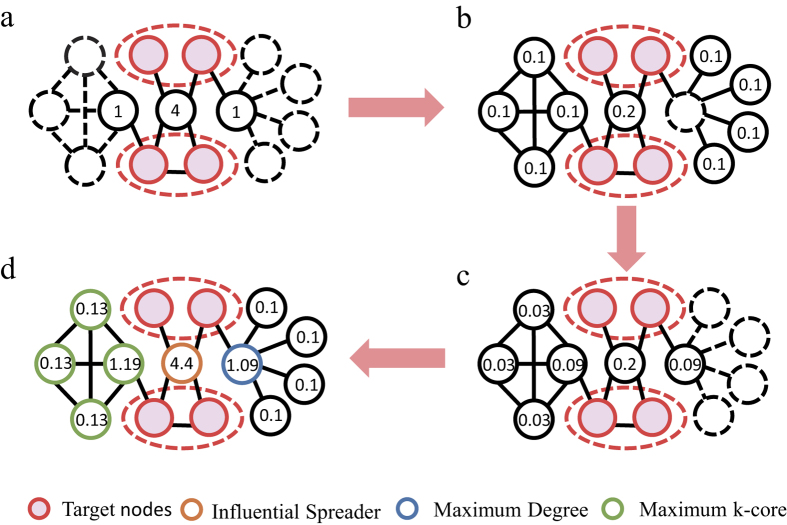
Figure 3. Illustrations of the reversed local path algorithm (RLP).
The red nodes are target nodes and others are non-target nodes. (a) The nodes with numbers are the first-order neighbors of the targets. All irrelevant nodes and edges are marked in dashed lines. The numbers on the nodes are obtained by computing f A. (b) The nodes with numbers are the second-order neighbors of the targets. All possible paths with length 2 are considered and the numbers on the nodes are obtained by computing  f A2. (c) The nodes with numbers are the third-order neighbors of the targets. All possible paths with length 3 are considered and the numbers on the nodes are obtained by computing
  2f A3. (d) The aggregated RLP score of non-target nodes are shown in this figure. The orange, blue and green nodes have maximum RLP, degree and k-core values, respectively.

