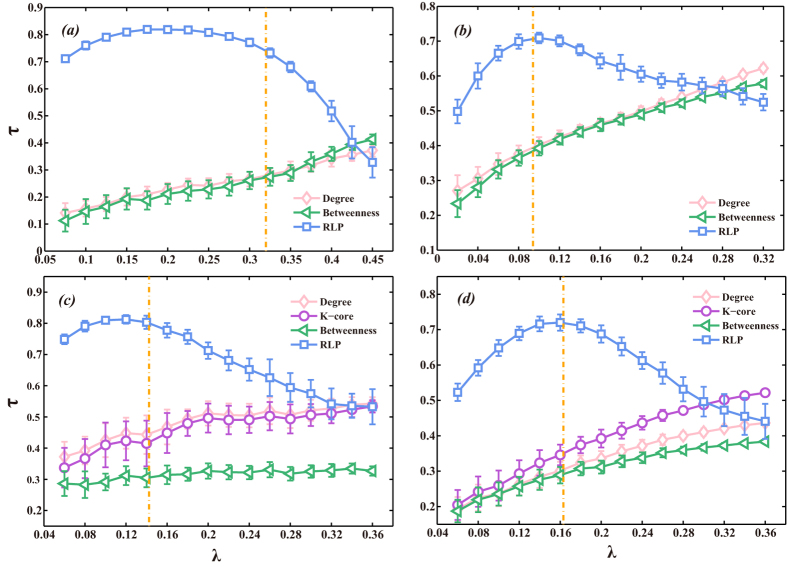
Figure 4. Kendall’s tau rank correlation coefficient τ between the rankings obtained from different methods and the true spreading ability ρ under different infection probabilities λ.
Four networks are considered, i.e. (a) WS, (b) BA, (c) Netsci and (d) Y2H networks. In each network, 30 target nodes randomly locate in the network. Ranking methods include degree (red diamonds), betweenness (green triangles), k-core (purple circles) or RLP (blue squares) methods. The orange dashed line corresponds to the critical infection probability. The results in each figure are obtained by averaging over 5000 independent realizations. In this figure, both WS and BA networks are with size N = 500 and mean degree 〈k〉 = 4. The results of the artificial networks with bigger size can be found in SI.

