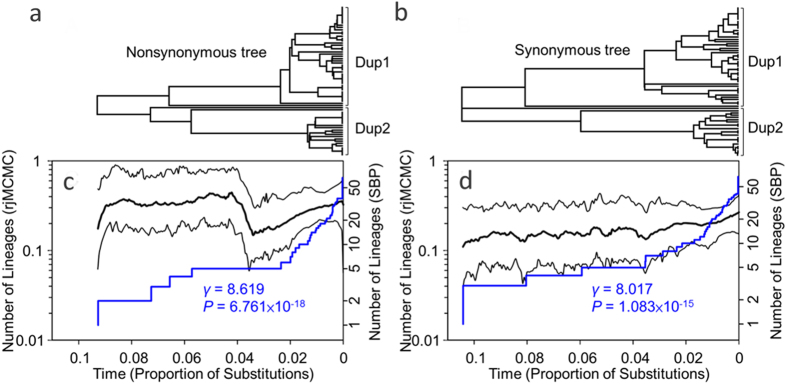
Figure 5. Lineage-through-time (LTT) plots inferred from trees of nonsynonymous and synonymous substitutions of DFR gene.
(a,b) represent topologies of nonsynonymous and synonymous trees, respectively, with the branch lengths corresponding to the relative times (denoted as the proportion of substitutions) in figures (c,d). (c,d) represent LTT plots estimated by reversible-jump Markov chain Monte Carlo (rjMCMC) method (black lines) and a constant birth-death stochastic branching process (SBP, blue lines) based on tree topologies of (A) and (C), respectively. Significant positives of γ-statistic for the SBP-LTT plots denote the late increase of diversification rate in both trees. The x-axes indicate relative time scale since DFR duplication.

