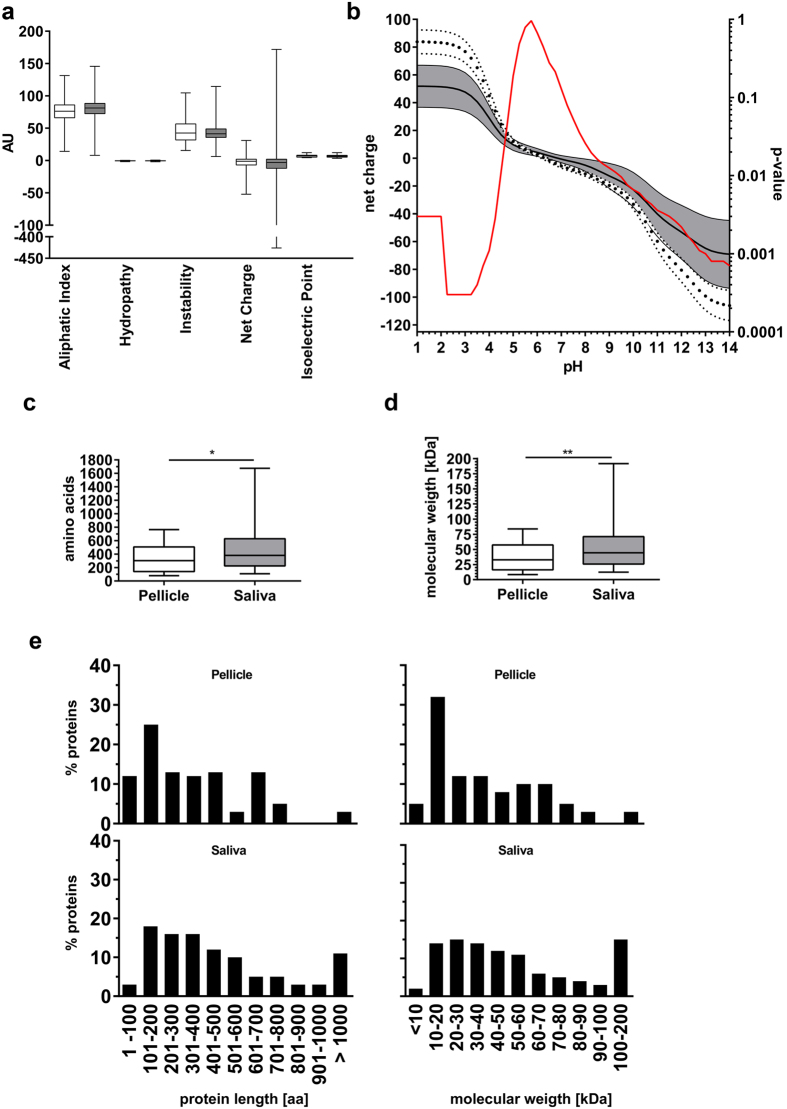
Figure 2. Physico-chemical properties of pellicle and salivary proteins.
(a) The box plots represent the median (box: 25th/75th percentiles, whiskers: minimum/maximum) physico-chemical properties of the pellicle (white) and salivary (grey) proteins. No statistically significant difference between both proteomes was found. (b) Mean net charge (±95% CI) of both proteomes at different pH. Pellicle proteins (white, dotted confidence strand) showed a higher positive net charge under acidic conditions (<pH 4.25) and higher negative charge under basic conditions (>pH 10.5). The red line indicates the calculated p-values for each pH. (c–e) Analysis of molecular weight and length of protein chains of pellicle (white) and salivary (grey) proteins. Pellicle proteins were significantly smaller than salivary proteins. The major fraction of pellicle proteins was smaller than 30 kDa or shorter than 300 amino acids. Large proteins (>100 kDa/>900 amino acids) were more often found in saliva. Statistical comparison of proteomes was performed using Mann-Whitney-U test: *p < 0.01, **p < 0.001.

