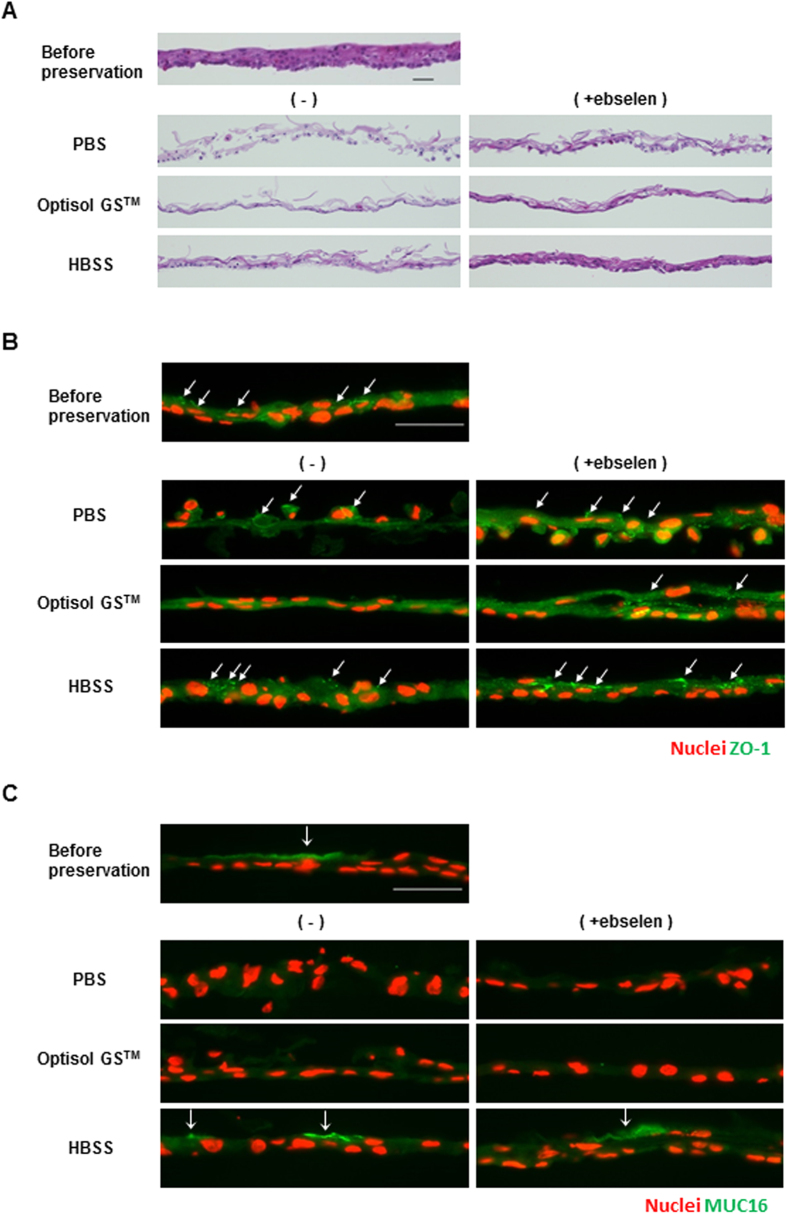
Figure 3. Morphology and expression of ZO-1 and MUC16 in hOEC sheets before and after preservation in PBS, Optisol GSTM, or HBSS with or without ebselen.
(A) Hematoxylin and eosin staining of hOEC sheets before and after preservation. Scale bars represent 50 μm. (B) Images of ZO-1 (green) expression and nuclei (red) of hOEC sheets before and after preservation. Scale bars represent 50 μm. (C) Images of MUC16 (green) expression and nuclei (red) of an hOEC sheet before and after preservation. Scale bars represent 50 μm.

