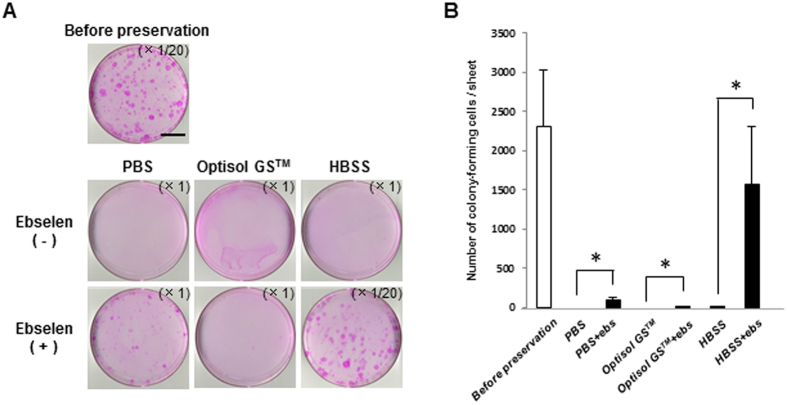
Figure 5. Colony-forming assay of hOEC sheets before and after preservation in PBS, Optisol GSTM, or HBSS with or without ebselen.
(A) Representative images of colonies in an hOEC sheet before and after preservation. Scale bars represent 25 mm. (B) Number of colony-forming units in the hOEC sheet before and after preservation. *P < 0.05 (for comparisons within a medium with or without ebselen [ebs]). Data represent mean ± SD of three independent experiments.

