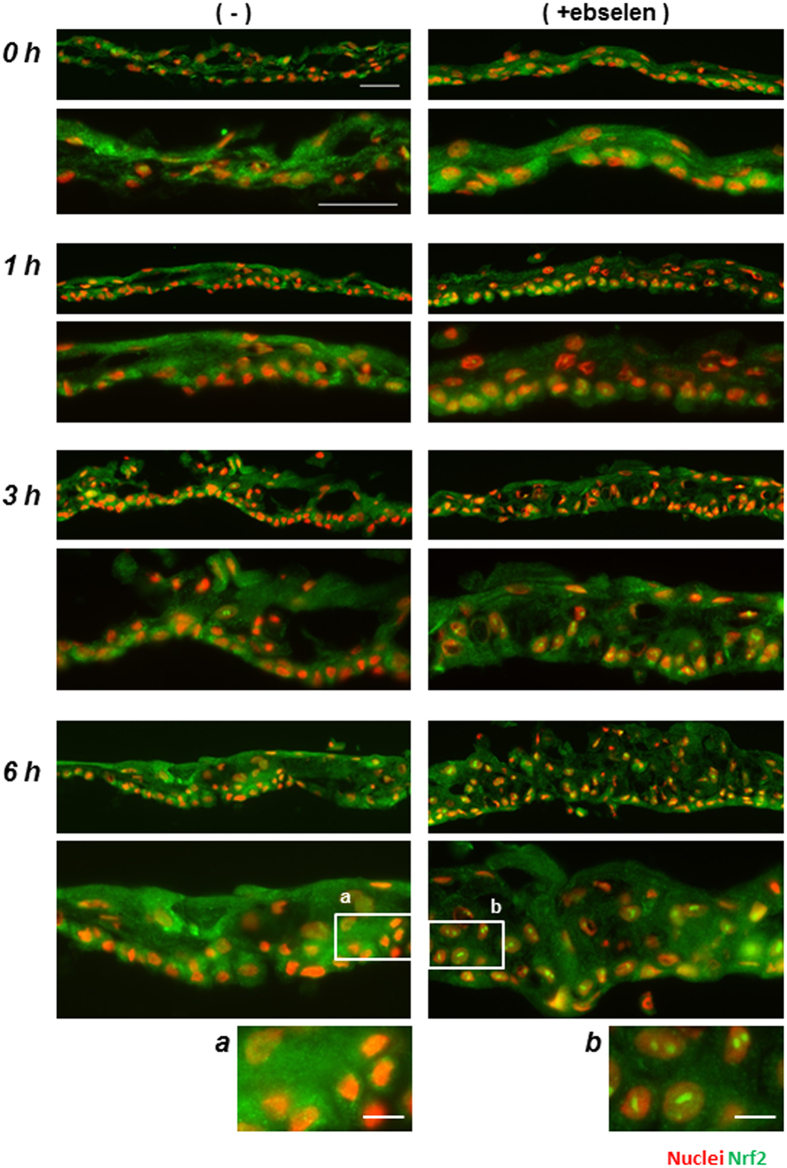
Figure 7. Effect of ebselen on Nrf2 nuclear translocation in hOEC sheets during re-culturing.
Images of Nrf2 (green) nuclear translocation of hOEC sheets during re-culturing. The magnification is ×200 (top) and ×400 (bottom) at each time point. Scale bars represent 50 μm. Images (a) and (b) represent magnified insets at the 6-hour time point (×200). Scale bars represent 10 μm.

