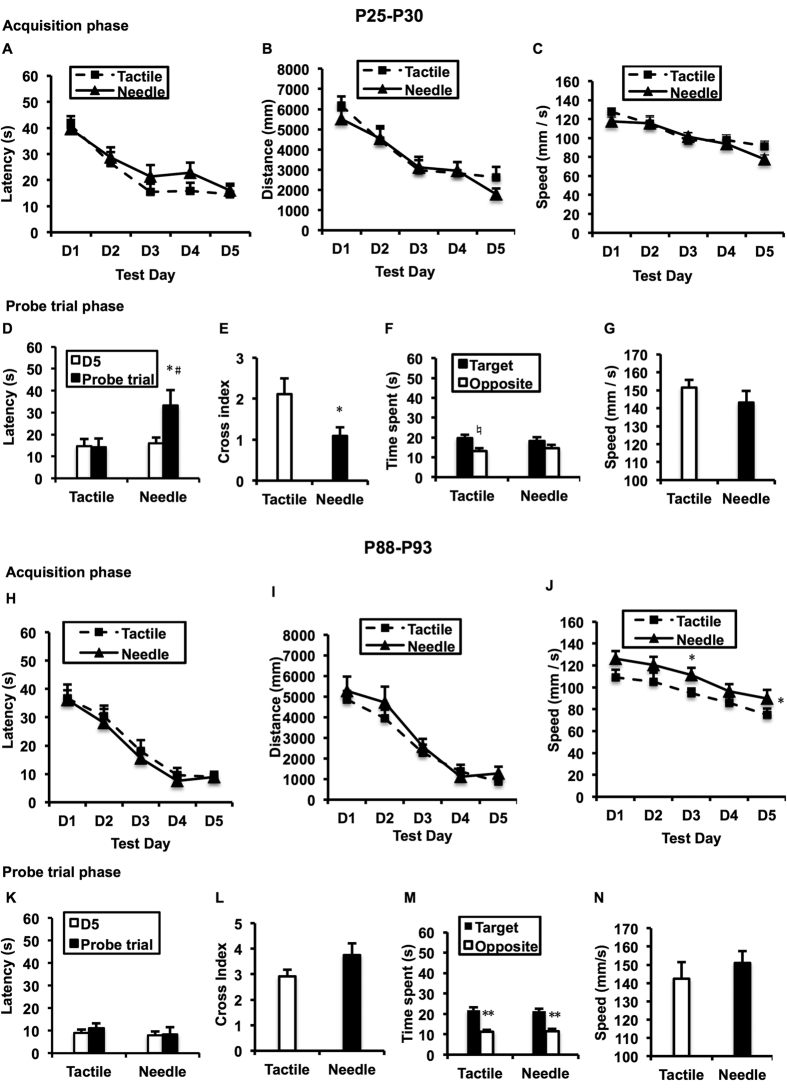
Figure 1. Morris water maze (MWM) performance.
Repeated-measures ANOVA was used to determine the significance of differences in latency to find the hidden platform (A,H), distance (B,I), and speed (C,J) between the two groups on P25-29 and P88-92 during the acquisition phase. Two-way ANOVA was performed to compare the main effects of neonatal treatment and test day (D,K), as well as the main effects of neonatal treatment and quadrant on P30 and P93 (F,M). The paired t-test was used to assess the latency difference between two test days and the time difference between two quadrants. The independent t-test was used to detect group differences in crossing index (E,L) and speed (G,N) on P30 and P93 during the probe trial phase. Data are expressed as the mean ± SEM. *P < 0.05, **P < 0.01 for Needle vs. Tactile (n = 12). #P < 0.05 for the last day of the acquisition phase vs. probe trial day (n = 12).

