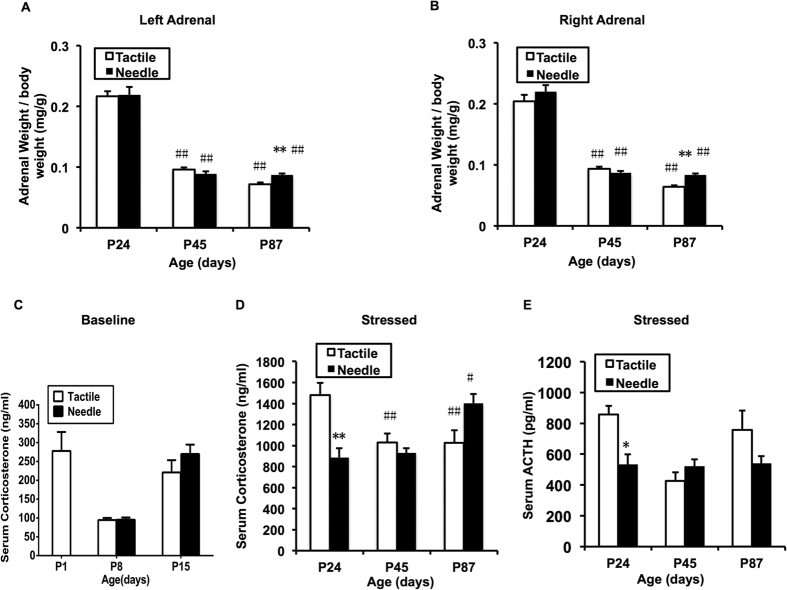
Figure 2. Relative weight of the adrenal glands, serum corticosterone and ACTH levels.
The two-way ANOVA test was used to detect group differences in left (A) and right (B) adrenal weights to body weight, basal corticosterone level (C) and stress-triggered corticosterone level following 30 min of exploration in the open-field (D), and stress-triggered ACTH level (E) at different ages between the two groups. The LSD post-hoc test was used to detect group differences at each age. Data are expressed as the means ± SEM. *P < 0.05, **P < 0.01 for Needle vs. Tactile; #P < 0.05, ##P < 0.01 compare to P24 (n = 10).

