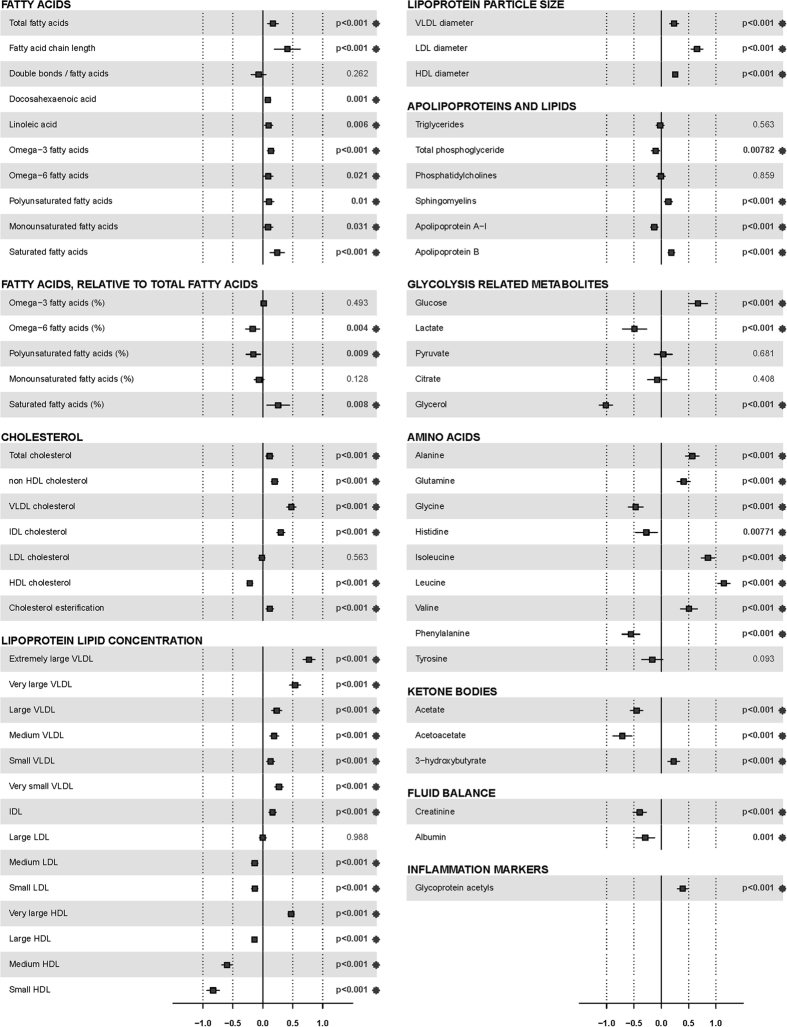
Figure 1. Intra-individual changes in metabolite levels after the standardized liquid meal.
Effect sizes are indicated in units of 1-SD metabolite concentration and adjusted for age, sex, status, lipid-lowering medication and hypertension medication. Squares indicate β-regression coefficients and error bars denote 95% confidence intervals. Double bonds/fatty acids: the number of double bonds in fatty acids. VLDL, very low density lipoprotein; IDL, intermediate density lipoprotein; LDL, low density lipoprotein; HDL, high density lipoprotein. Asterisk behind the p-value indicates a significant association after FDR correction.

