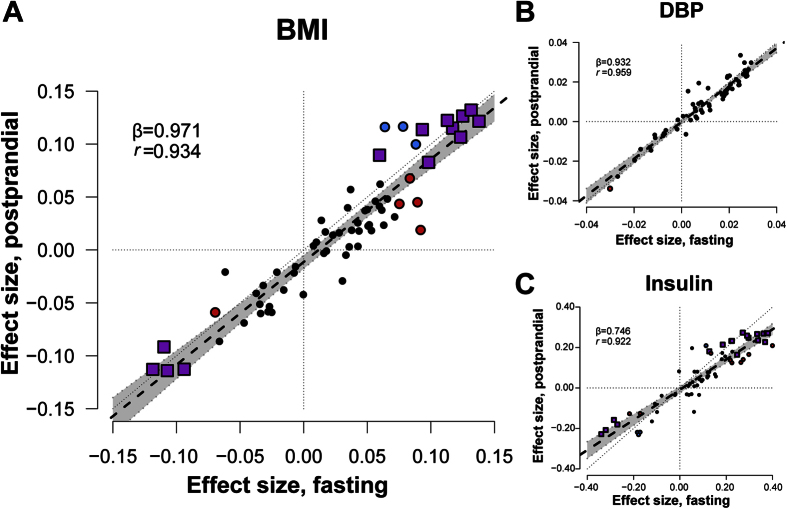
Figure 3. Effect size of the association between BMI, diastolic blood pressure (DBP) and insulin and metabolites before and after the standardized liquid meal.
(A) BMI: Effect sizes indicate the association magnitudes in units of 1-SD metabolite concentration per 1-kg/m2 increment; (B) DBP: 1-SD metabolite concentration per 1-mm Hg increment; (C) Insulin: 1-SD metabolite concentration per 1-SD increment. Each dot represents a metabolite. Purple squares indicate the metabolite was significantly associated with BMI before and after the standardized liquid meal; Red circles: only significant in fasting samples; blue circles: only significant in postprandial samples; black circles: not significant in fasting and postprandial samples.

