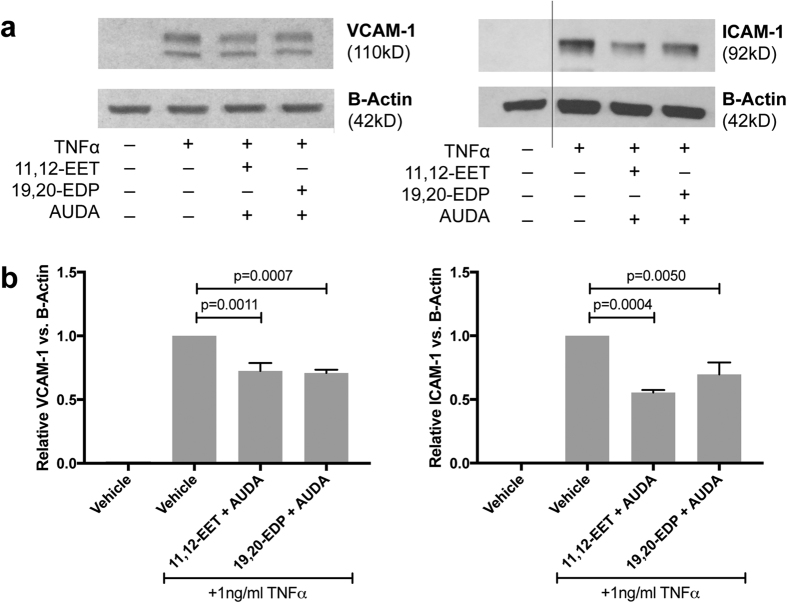
Figure 3. The effect of 11,12-EET or 19,20-EDP plus sEH inhibition on TNFα-induced VCAM-1 and ICAM-1 protein levels.
(a) Representative blots from HRMEC treated with TNFα in the presence or absence of 11,12-EET (0.5 μM) or 19,20-EDP (0.5 μM) with AUDA (10 μM); and (b) quantification of 3 individual blots. Each bar represents the mean ± SEM (n = 3).

