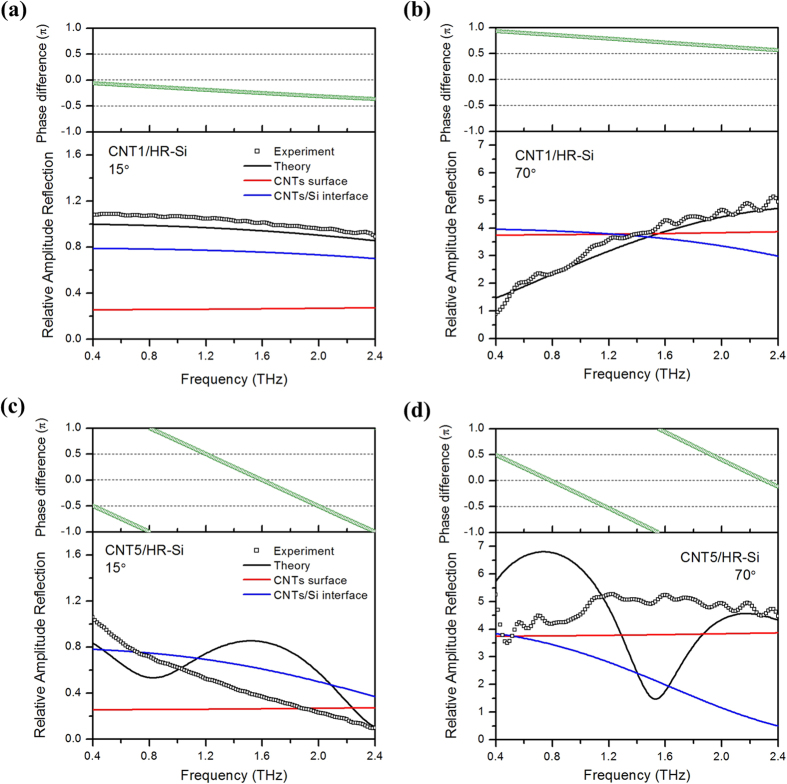
Figure 7.
Frequency dependent relative amplitude reflection and phase difference of (a) CNT1 at 15°, (b) CNT1 at 70°, (c) CNT5 at 15° and (d) CNT5 at 70°. In each top figure, green lines is the theoretical phase difference of reflection from CNT layer surface and CNTs/HR-Si interface. In each bottom figure, Black circle points represent the experiment values, black lines are the corresponding theoretical relative amplitude reflection, red and blue lines are the theoretically calculated relative amplitude reflection from CNT layer surface and CNTs/HR-Si interface, respectively.

