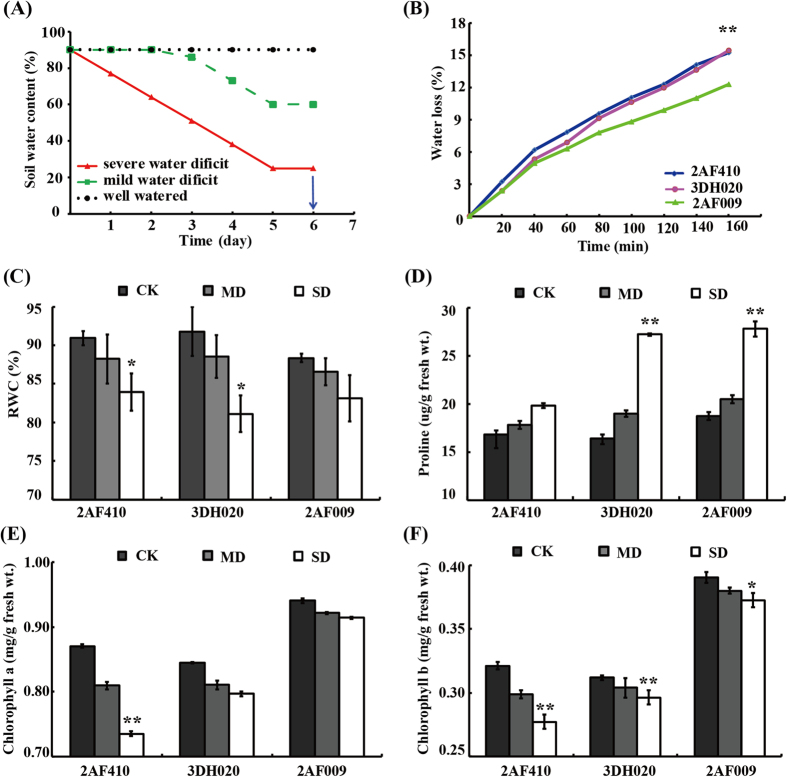
Figure 1. Measurement of physiological changes.
(A) Illustration of drought treatments. For the control group, soil water content was kept about 90%. For mild and severe drought treatment, water was withheld at day 0 and day 2 respectively, and the progress of drought was monitored by soil moisture. Finally, leaves were collected at day 6. (B) Water loss rates in the excised leaves. Leaves were detached and exposed to cool white light at 22 °C, weighed to determine water loss rates (percent of fresh weight, FW%) at different time points. Asterisk indicates water loss rates of different cultivars are significantly different (*p-value < 0.05, **p-value < 0.01). Three independent biological replicates were performed for each time point (n = 3). (C) RWC of leaves was measured after drought treatment at day 6. (D) Proline accumulation analysis. (E) Chlorophyll a content analysis. (F) Chlorophyll b content analysis. Statistically significant differences relative to the control were calculated by independent Student’s t tests. Asterisk indicates control and drought-stressed samples are significantly different (*p-value < 0.05, **p-value < 0.01). The values are presented as means ± standard error (SE); n = 3 for all groups. The bars represent the SE.

