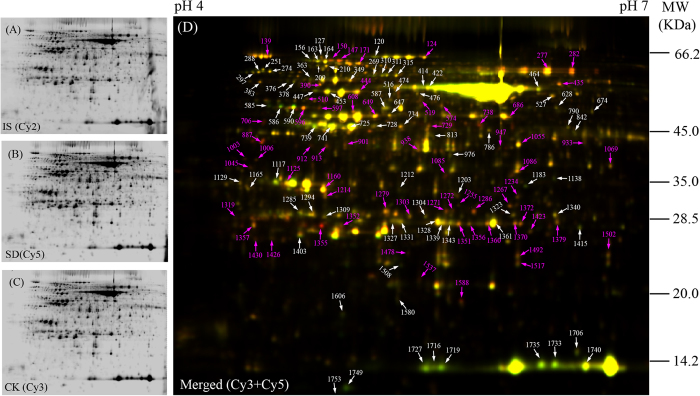
Figure 2. Representative 2D-DIGE image of rapeseed leaves proteins under drought treatment.
Leaf proteins were labeled with different fluorescence dyes. The combined images of each sample with internal standard (IS, labeled with Cy2) are presented (A). Proteins of Cy5-labeled SD group samples (C) were compared with those of Cy3-labeled CK samples (B) by 2D-DIGE using 24-cm pH 4-7 IPG strips and 12.5% SDS-PAGE gel. The 138 DAPs were marked with arrows (red arrows, protein spots significantly up-regulated upon drought treatment; white arrows, down-regulated protein spots) presented in merged 2D-DIGE gel (D). All of the labeled protein spots were identified by MS/MS, and the detailed information were listed in Supplemental Table S1 and Fig. S2.

