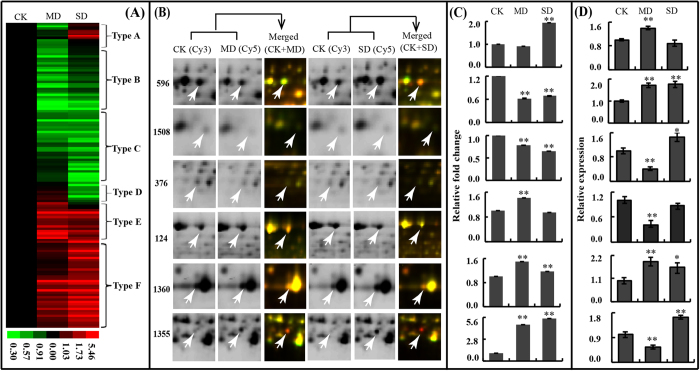
Figure 3. Clustering and expression profile of DAPs.
(A) Hierarchical clustering of DEP spots under mild and severe drought treatment (MD and SD). Six dominant expression profile types are determined (type A to type F). (B) Enlarged areas of representative protein spots (arrow labeled) in 2D-DIGE gels of MD and SD, corresponding to the changed types A (spot 596, RCA), B (spot 1508, uncharacterized protein), C (spot 376, TIG), D (spot 124, TKL-1), E (spot 1360, βCA1), and type F (spot 1355, FER1), respectively. (C) The relative expression fold changes of protein spots in Figure 3B at protein level. (D) The relative transcription levels of proteins (spots 596, 1508, 376, 124, 1360 and 1355) that determined by qRT-PCR assay. The relative expression levels of CK was set to 1 in (C) and (D). Asterisk indicates control and drought-stressed samples are significantly different (*p-value < 0.05, **p-value < 0.01). The values are presented as means ± standard error (SE); n = 3 for all groups. The bars represent the SE.

