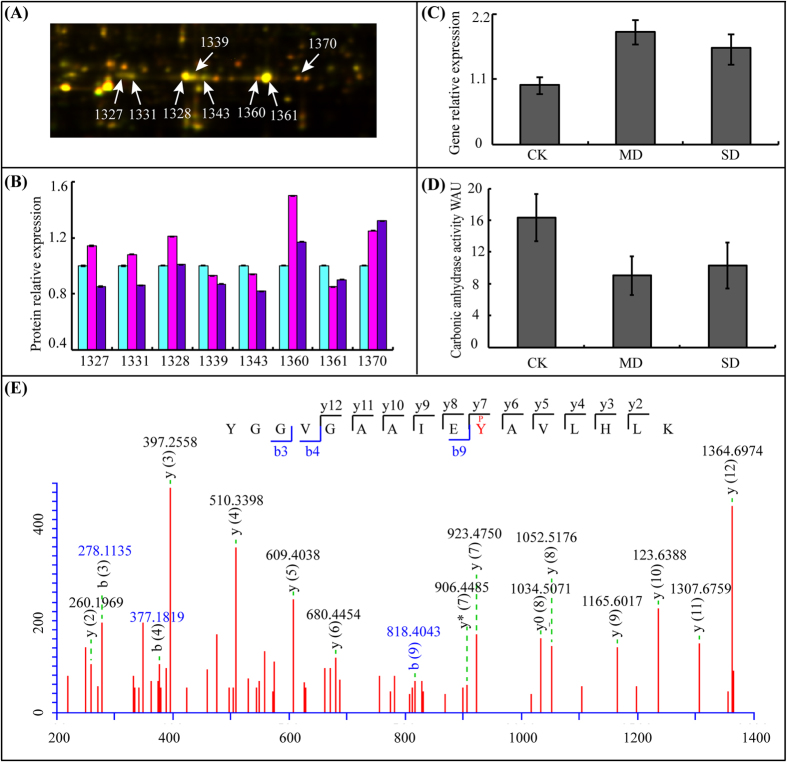
Figure 5. Expression pattern and activity analysis of βCA1.
(A) The abundance profiles of beta carbonic anhydrase 1 (GI No. 297789439) was provided, and these protein isoforms were identified from eight different spots (1327, 1331, 1328, 1339, 1343, 1360, 1361, and 1370). (B) The relative abundance of the eight βCA1 at protein level. (C) Relative transcript levels of the βCA1 as determined by qRT-PCR under drought stress treatment. (D) Carbonic anhydrase activity assays. (E) Phosphopeptide MS/MS spectra map showed the phosphorylation sites at Tyr207. Asterisk indicates control and drought-stressed samples are significantly different (*p-value < 0.05, **p-value < 0.01). The values are presented as means ± standard error (SE); n = 3 for all groups. The bars represent the SE.

