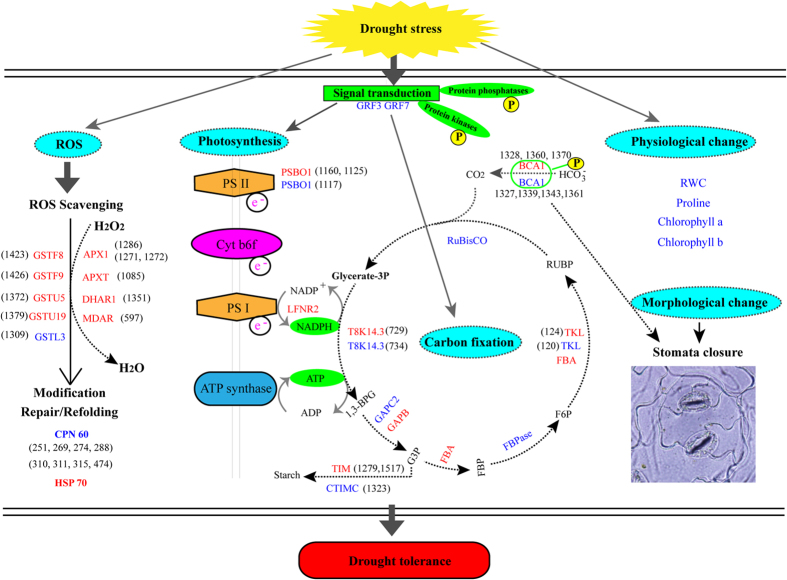
Figure 7. Schematic representation of βCA1 involved in different mechanism pathways for drought tolerance in B. napus.
The identified DAPs were used to construct the schematic representation. Most differentially expressed proteins were integrated and are indicated in red (up-regulated under drought treatments) or blue (down-regulated), respectively. The abbreviations were provided in the Supplemental Table S1.

