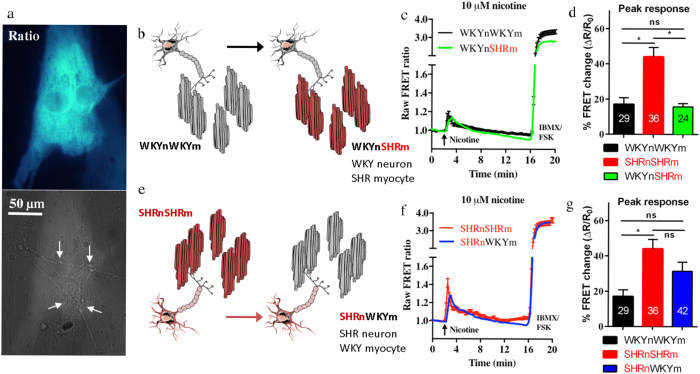
Figure 5. The cardiac sympathetic stellate neurons are the primary driver of the cardiac sympathetic hyper-activity associated with pro-hypertensive states.
To investigate whether the neuron or the myocyte is the primary driver of the co-culture phenotype we see, we created two cross-cultures (see Fig. 1 for schematic). The myocytes were selectively infected with the cAMP Ad-Epac-SH187 FRET sensor (a) neuronal processes marked by the arrows before 10 μM nicotine was applied. The first cross-culture was created by plating healthy WKY neurons on top of pro-hypertensive myocytes, creating the WKYnSHRm cross-culture (b). The WKY neurons were found to attenuate the myocyte cAMP responses of the pro-hypertensive SHR myocytes (c,d). The nicotine evoked cAMP responses in the WKYnSHRm were significantly smaller than those of the SHRnSHRm (15.67 ± 1.936, n = 24 (9 animals/4 coverslips/24 cells) vs 44.02 ± 5.310, n = 36 (13 animals/4 coverslips/36 cells), p < 0.0001) and not significantly different from that of the WKYnWKYm cultures (15.67 ± 1.936, n = 24 vs 17.05 ± 3.715 n = 29 (29 animals/9 coverslips/29 cells), p = 0.76). Moreover, the pro-hypertensive SHR neurons were able to induce a diseased myocyte cAMP phenotype on the otherwise healthy WKY myocytes (b,c). The cAMP levels of the SHRnWKYm were substantially (though not significantly) larger than those of the WKYnWKYm (31.37 ± 5.194, n = 42 (21 animals/9 coverslips/42 cells) vs 17.05 ± 3.715, n = 29). This response was not significantly different from the diseased SHRnSHRm culture (31.37 ± 5.194, n = 42 vs 44.02 ± 5.310 n = 36, p = 0.094) suggesting a partial recapitulation of the diseased phenotype. (c,f) represent the mean raw traces of all recordings made. The mean without SEM is reported for the cross-cultures for clarity. Statistical analysis (one-way ANOVA with Bonferroni correction) was performed on the mean absolute peak data ± SEM (d,g). Panel b and e were created using Servier Medical Art according to a Creative Commons Attribution 3.0 Unported License guidelines 3.0 (https://creativecommons.org/licenses/by/3.0/). Simplification and colour changes were made to the original neuron and mycoyte cartoons.

