
Figure 2. Comparison of gene expression in DG-8052 in P2 medium with CaCO3 vs DG-8052 in P2 medium.
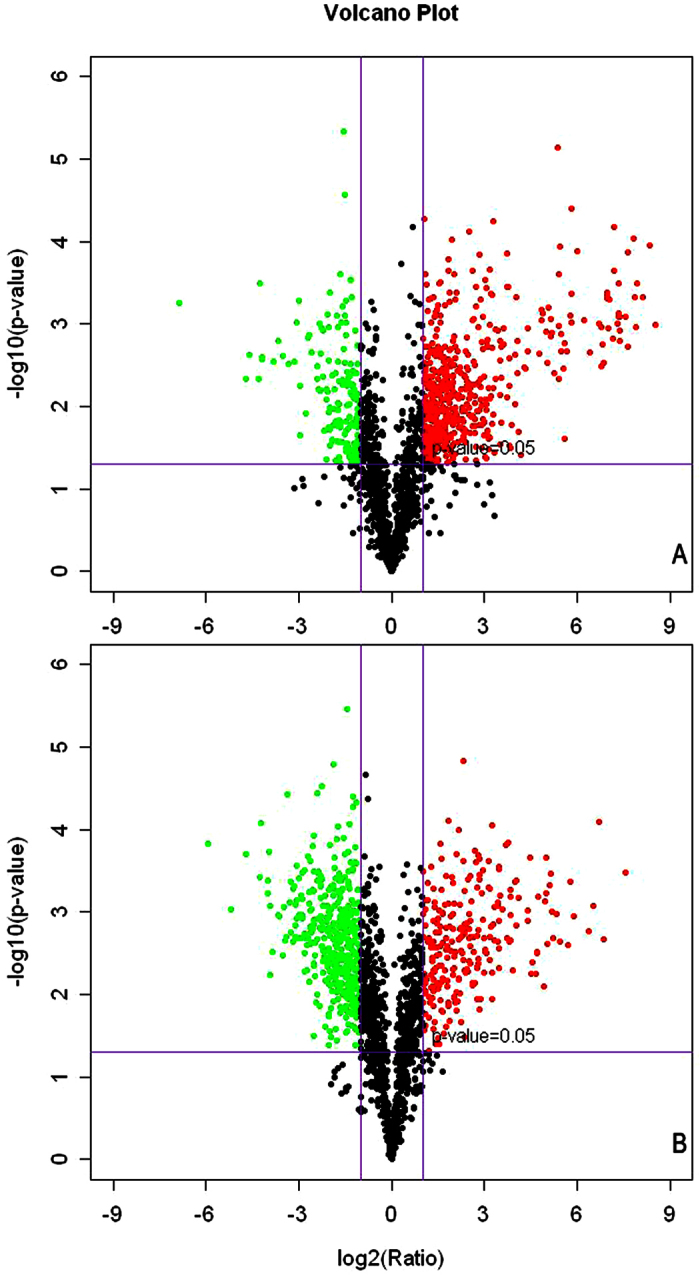
Cells from both strains were taken at 12 h and 24 h to compare transcriptome profiles at acidogenic (A) and solventogenic (B) phases, respectively. Genes with significantly differential expression (fold change >2 and p-value < 0.05) between the two strains were shown in green (down-regulated) and red (up-regulated) while the others with non-significantly differential expression were shown in black.