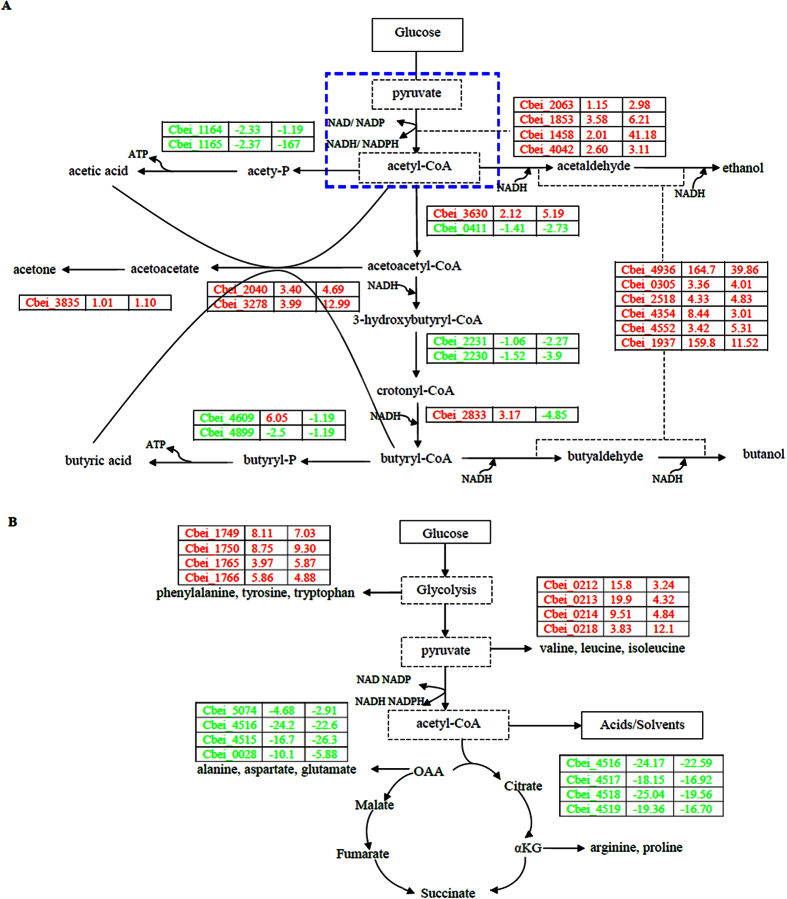
Figure 5. Schematic diagram showing the primary steps in conversion of glucose into fermentation products in C. beijerinckii DG-8052.
Acids/solvents producing pathway (A), amino acids producing pathway (B). The fold change (FC) value is indicated directly beside the gene ID of 12 h and 24 h respectively. Text in red and green represents the up-regulated and down-regulated genes, respectively. The blue dash box indicated the synthesis of acetyl-CoA from pyruvate. Detailed enzymes and their associated gene ID can be found in Supplementary Data Table S4A,4C.

