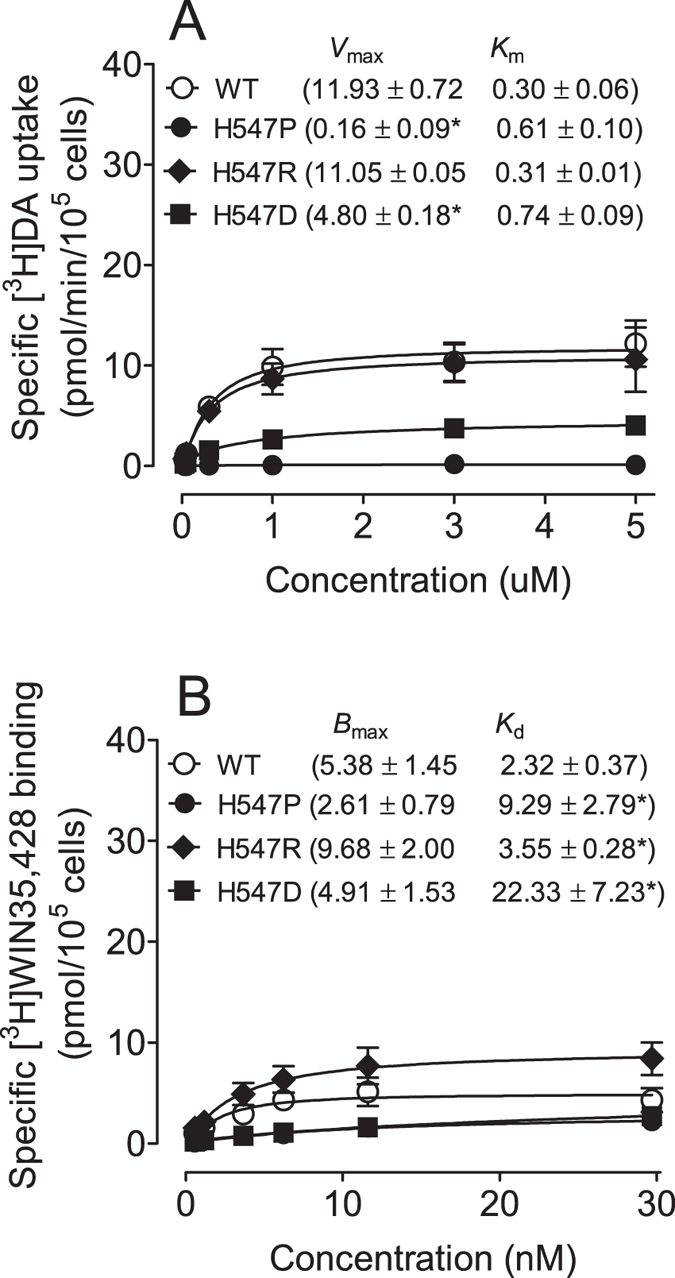
Figure 3. DA transport and DAT surface binding sites in WT hDAT and H547 substitutional mutants.

(A) Kinetic analysis of [3H]DA uptake in WT hDAT and mutants. The Vmax and Km values were estimated by fitting the data to the Michaelis-Menten equation and represent the means from five independent experiments ± S.E.M. *p < 0.05 compared to WT hDAT value (unpaired Student’s t test) (n = 5). (B) Saturation binding of [3H]WIN35,428 in intact PC12 cells transfected with WT hDAT and mutants. The Bmax and Kd values were estimated by fitting the data on a one-site binding curve and represent the means from four independent experiments ± S.E.M. *p < 0.05 compared to control value (unpaired Student’s t test) (n = 4).
