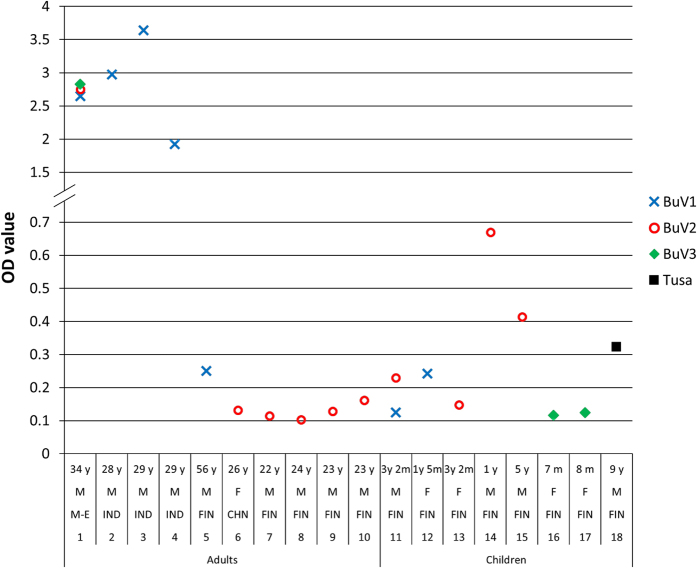
Figure 2. BuV and TuV IgG-positive adults and children.
The figure presents the EIA OD values from the samples. Blue x marks the BuV1 IgG level in the sample, red circle the BuV2 IgG level, green diamond the BuV3 IgG level and the black square the TuV IgG level. Below each result the following information is presented: Age, gender, geographical background (M-E = Middle-East, IND = India, CHN = China, FIN = Finland), case number and cohort.

