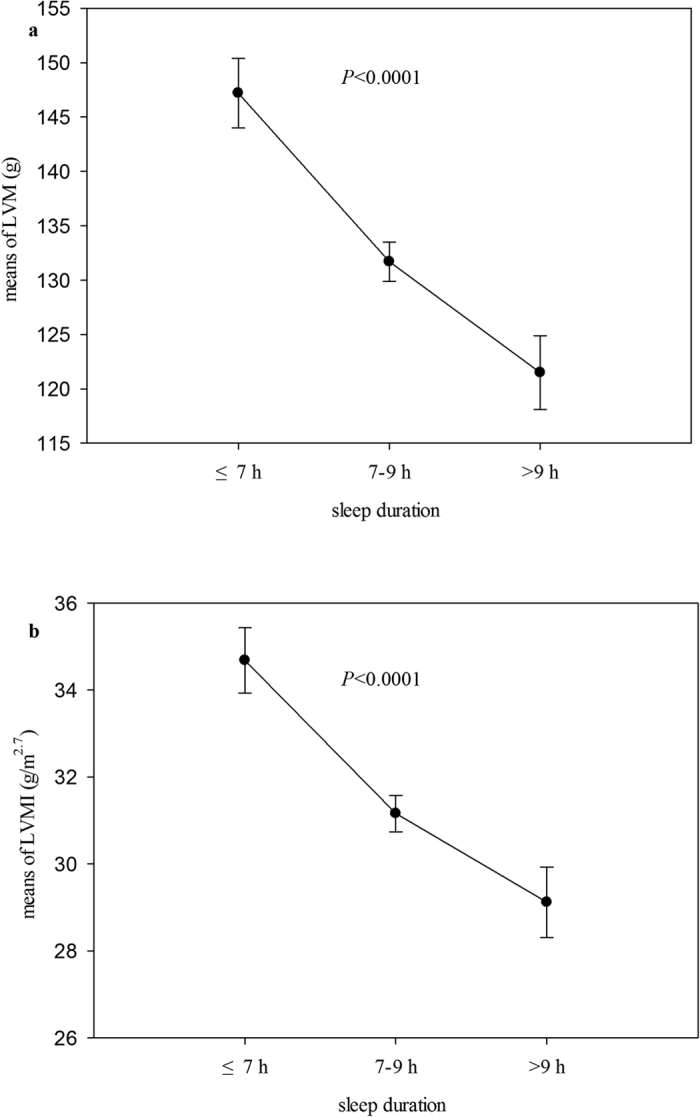
Figure 1.

LVM (a) and LVMI (b) by sleep time. Values displayed as geometric mean concentrations and 95% confidence interval. Models adjusted for age, gender, height, weight, waist circumference, blood pressures, lipids, HbA1c, HOMA-IR, leptin, adiponectin, hs-CRP, smoking, physical activity and sleep quality.
