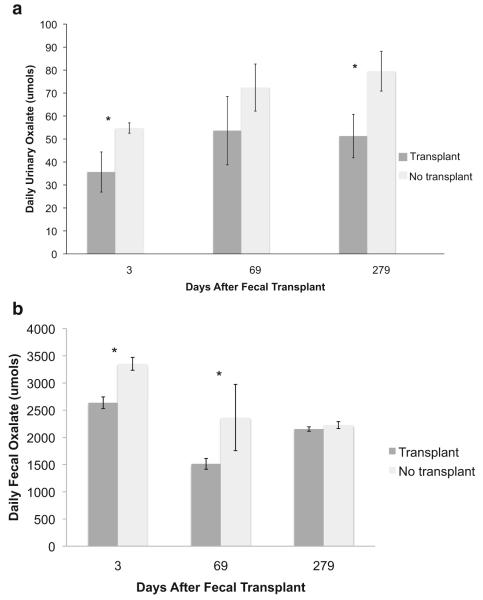
Fig. 2.
Oxalate excretion between the transplant and no-transplant groups 3, 69, and 279 days after the fecal transplant. a Urinary oxalate excretion. Data were analyzed with a repeated measures ANOVA (treatment (1,8) P = 0.03). *Significant differences within each time point as assessed with a Tukey’s post hoc analysis. b Fecal oxalate excretion. Data were analyzed with a repeated measures ANOVA (treatment (1,8) P < 0.001, time (2,18) P < 0.001, time × treatment (2,32) P = 0.008). *Significant differences within each time point as assessed with a Tukey’s post hoc analysis

