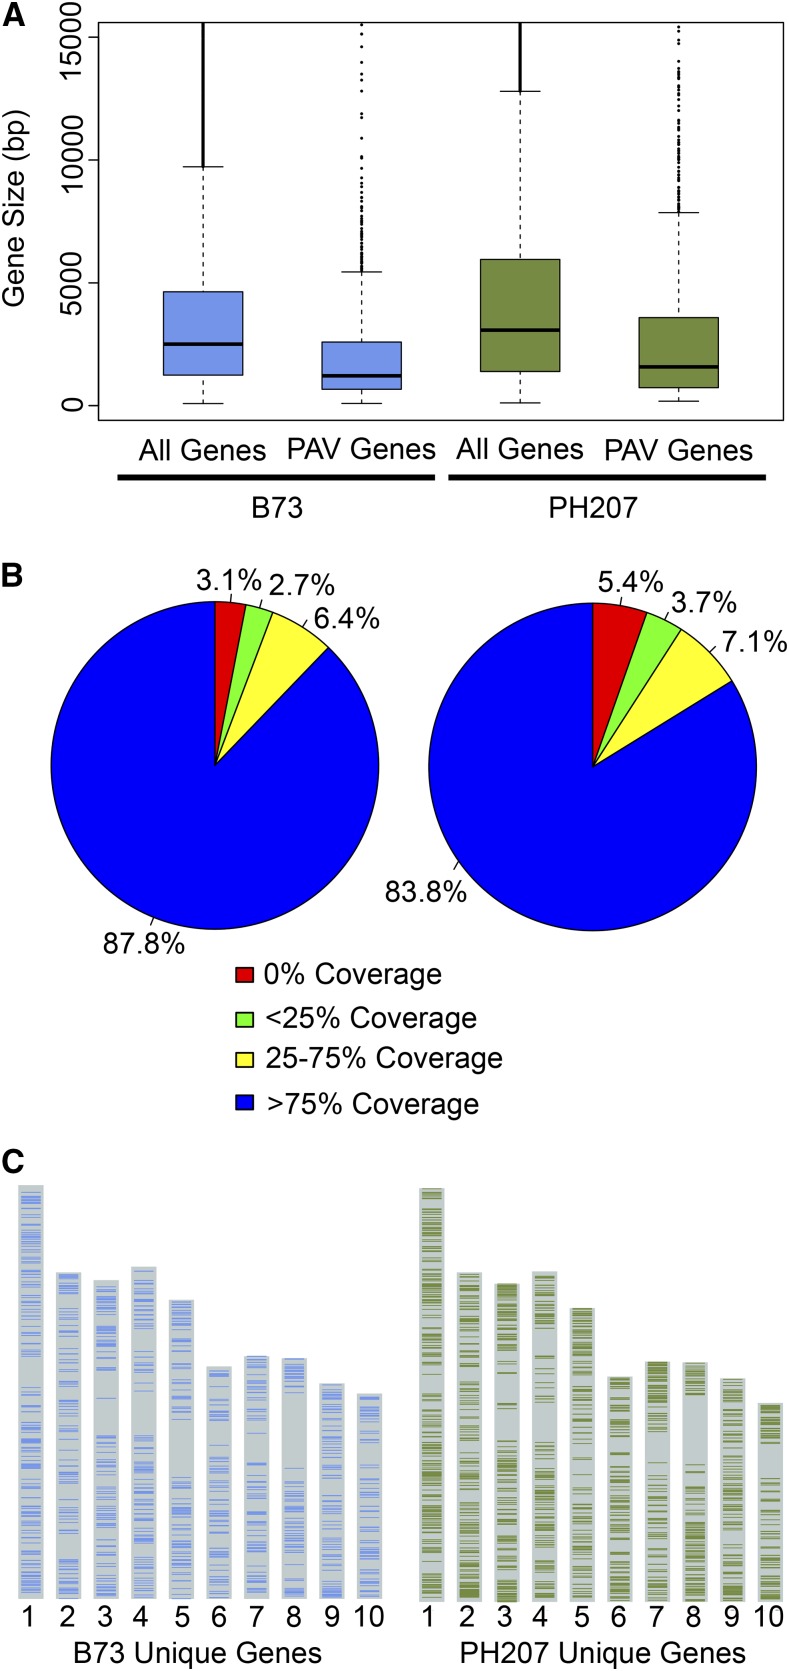
Figure 2.
Genome Content Distribution in Elite Maize Inbred Lines B73 and PH207.
(A) Distribution of gene size for all B73 and PH207 genes and genes showing PAV. The whiskers are plotted at a maximum of 1.5 times the interquartile range away from the end of the box in each direction.
(B) Distribution of partial gene deletions in B73 (right) and PH207 (left) genes relative to the genome in which the gene was annotated based on the ratio of coverage from resequencing data.
(C) Genome-wide distribution of B73 and PH207 unique genes.

