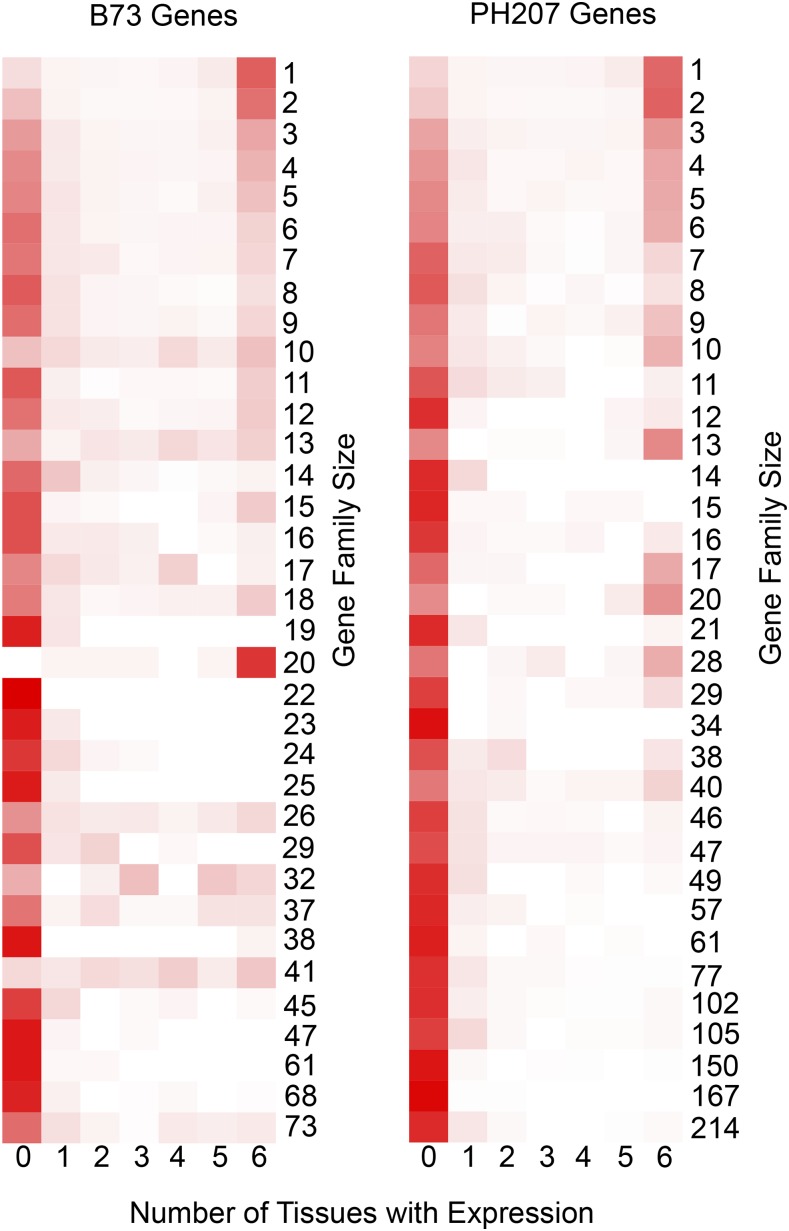
Figure 5.
Relationship between Gene Family Size and Transcriptional Variation.
Gene families were determined using homologous gene clustering with B73 and PH207 gene models. Heat maps show the proportion of genes in families of size N with expression in zero to six tissues, which include leaf blade, root cortical parenchyma, root stele, germinating kernel, root tip, and whole seedling. White color indicates no genes are expressed and red indicates all genes are expressed.

