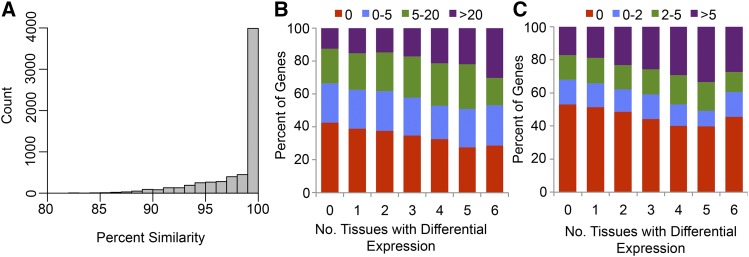
Figure 6.
Relationship between Variation in Promoter Sequence and Transcriptional Variation.
(A) Distribution of percentage of similarity of promoter sequences between B73 and PH207 genes in the region 1 kb upstream of the transcription start site for genes that show a one-to-one relationship in the two genome assemblies.
(B) Relationship between number of tissues with differential expression and number of SNPs per kilobase in the promoter sequence.
(C) Relationship between number of tissues with differential expression and number of InDels per kilobase in the promoter sequence.

