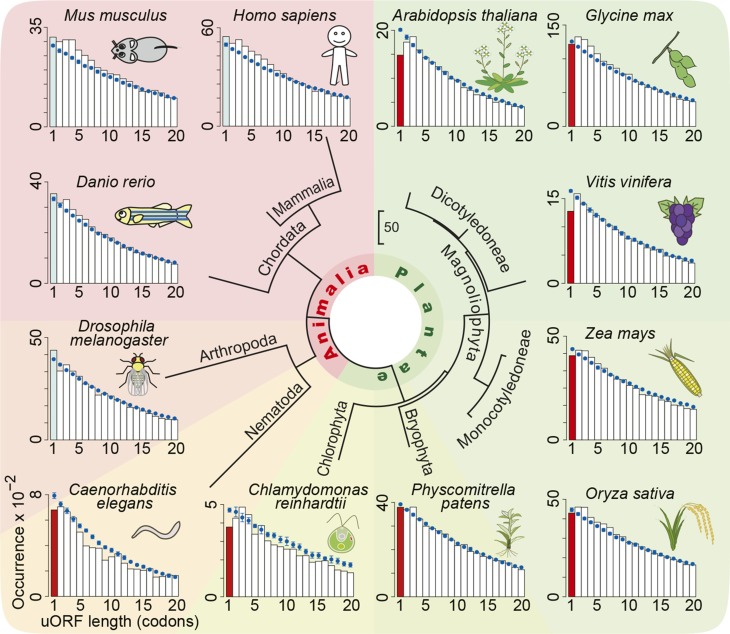
Figure 11.
Distribution of uORF Lengths in Various Eukaryotic Species.
Distributions of uORF lengths in the annotated transcripts are shown in bar plots. The calculated distributions of uORF lengths after randomization of 5′-UTR sequences are shown in blue (mean ± sd). Frequency of AUG-stops lower than expected is shown in red.

