
Figure 1.
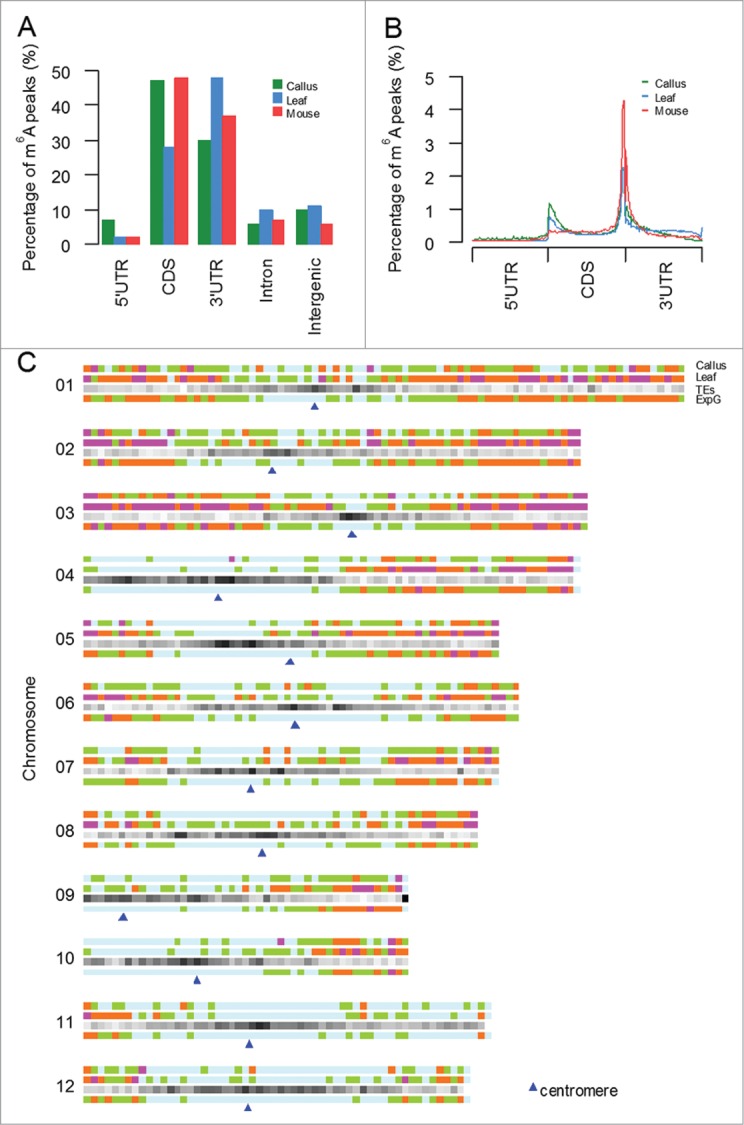
Distribution of m6A modification peaks along mRNA and chromosome (A) Transcriptome-wide distribution of m6A peaks. Bar graph shows the fraction of m6A peaks in each of the 5 non-overlapping transcript segments. (B) Distribution of m6A peaks across the length of mRNAs. 5′UTRs, CDS, and 3′UTRs of rice mRNAs are individually binned into regions spanning 1% of their total length, and the percentage of m6A peaks that fall within each bin is determined. (C)Distribution of m6A peaks along chromosomes of callus and leaf tissues. From top to bottom, 3 horizontal bars represent chromosomes, where the m6A peak density in callus, leaf, TE gene and expressed gene (taking callus as samples) in 500-kb windows are displayed with scales as indicated. Diamonds in different colors (light blue->green-> brown->purple) represent numbers of peaks or genes ascending.