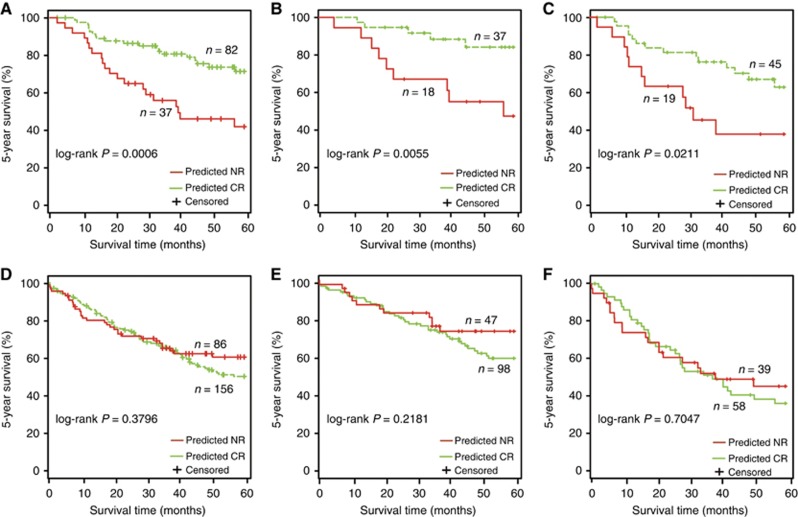
Figure 3.
The Kaplan–Meier curves of 5-year survival between different response groups predicted by 3-GPS in the testing data set. (A) All patients receiving platinum-based ACT. (B) Stage IB patients receiving platinum-based ACT. (C) Stage II–III patients receiving platinum-based ACT. (D) All patients not receiving ACT. (E) Stage IB patients not receiving ACT. (F) Stage II–III patients not receiving ACT.

