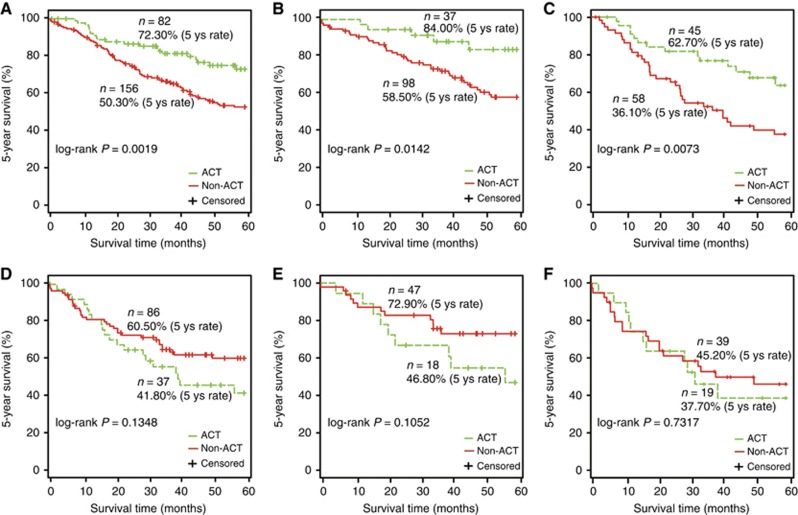
Figure 4.
The benefits of ACT in 5-year survival rate for the different response groups predicted by 3-GPS in the testing data set. (A) All patients in the predicted CR group. (B) Stage IB patients in the predicted CR group. (C) Stage II–III patients in the predicted CR group. (D) All patients in the predicted NR group. (E) Stage IB patients in the predicted NR group. (F) Stage II–III patients in the predicted NR group. The 5 ys rate represents 5-year survival rate.

