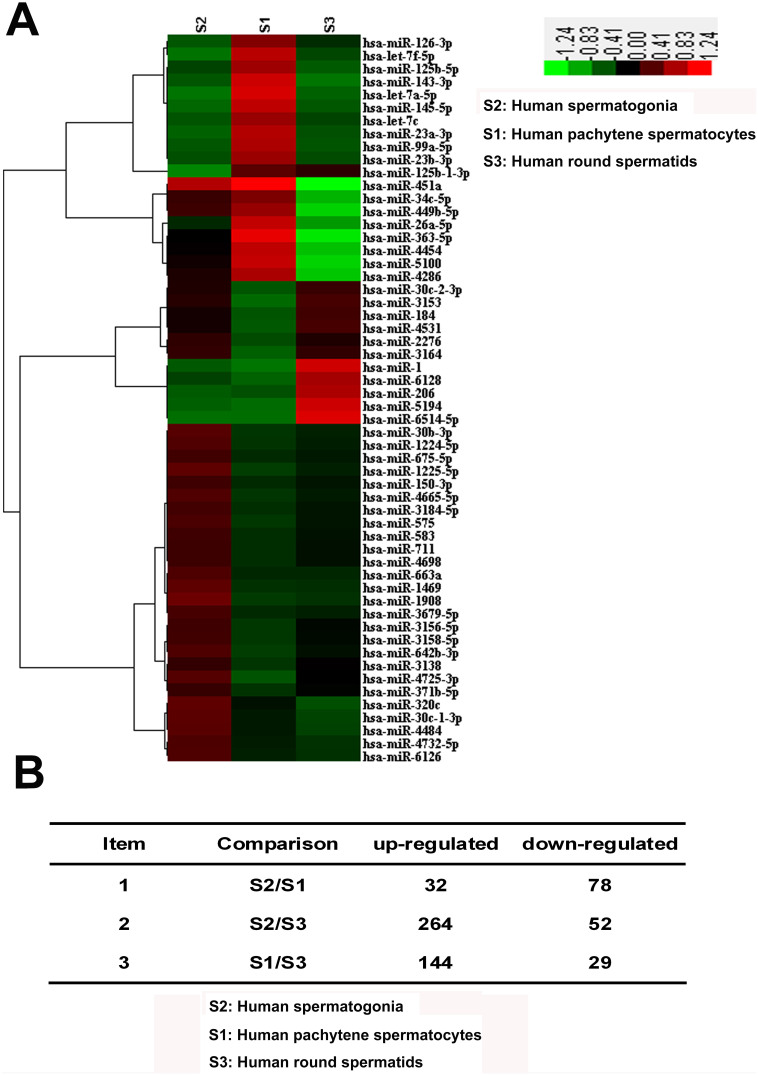
Figure 4. Distinct miRNA expression profiles among human spermatogonia, pachytene spermatocytes and round spermatids.
(A), Hierarchical clustering showed the differentially expressed miRNAs among human spermatogonia, pachytene spermatocytes and round spermatids. A total of 599 differentially expressed miRNAs was found from 2,400 microRNA microarray database, based on 1.5-fold and greater difference among human spermatogonia, pachytene spermatocytes and round spermatids. Up-regulated and down-regulated genes were represented in red and green colors, respectively. (B), The number of differentially expressed miRNAs was shown among human spermatogonia, pachytene spermatocytes and round spermatids. The data shown in (A–B) were representatives from two independent experiments of twenty patients.

