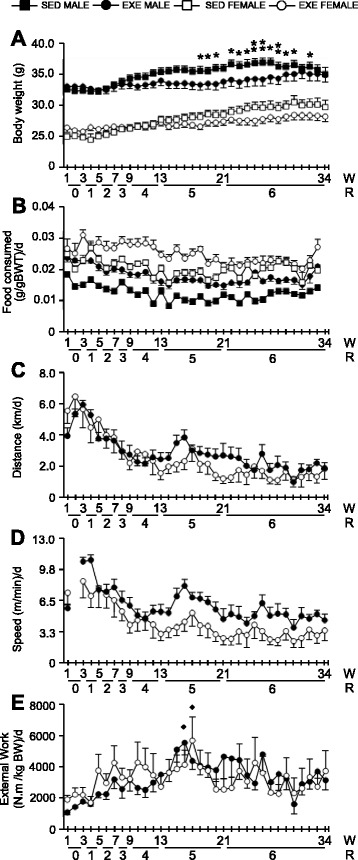
Fig. 1.

Average weekly body weights (a), food consumption (b), running distance (c), speed (d), and external work (e) in males and females in both SED and RWE cohorts over 34 weeks. The asterisks indicate significant differences between sedentary and exercised mice (data were pooled for sex; *P < 0.05; **P < 0.01). Diamond indicates a significant effect of age ♦ P < 0.05. Data for “speed” at week 2 are missing due to technical issues. For each weekly time point, data are mean ± SEM. N = 6–10 mice per group
