Fig. 7.

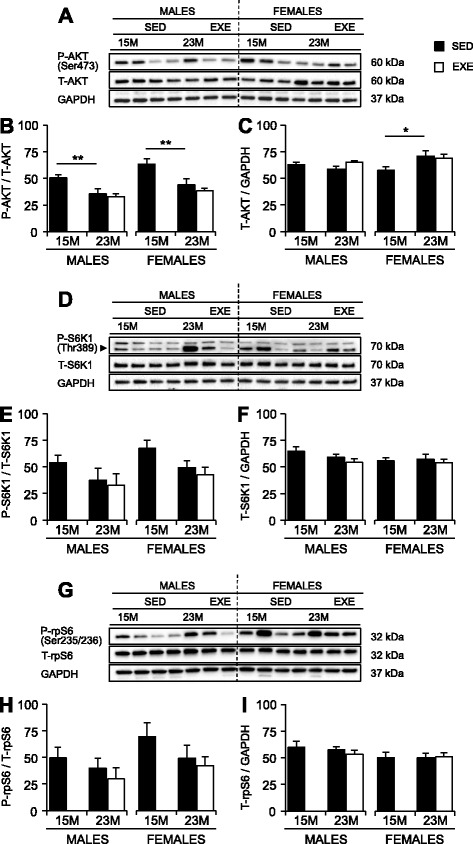
Phosphorylated (p-) and total (t-) protein amounts for AKT, S6K1, and rpS6 in the quadriceps muscles of 15-months SED, 23-month SED, and 23-month RWE mice, of both sexes. p-AKT(Ser473) (a, b), p-S6K1(Thr389) (d, e), and p-rpS6(Ser235/236) (g, h) were quantified relative to their respective total protein amounts. T-AKT (a, c), t-S6K1 (d, f), and t-rpS6 (g, i) were quantified relative to the loading control, GAPDH. Data were analyzed by ANOVA, using age and sex and sex and activity as variables. Data are mean ± SEM. Asterisk denotes significance at *P < 0.05; **P < 0.01; ***P < 0.001. For each age group, N = 6–10 mice/group. Y-axes represent arbitrary units
