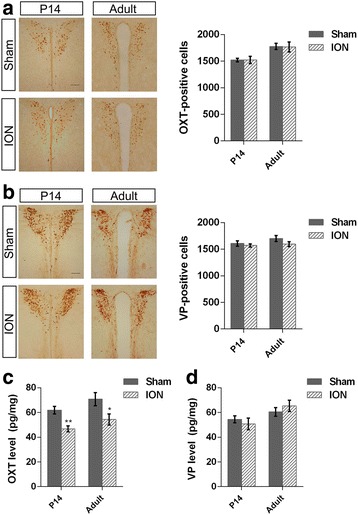
Fig. 6.

Immunoreactivity and peptide level of hypothalamic OXT and VP in P14 and adult mice. a Left: representative images of OXT immunoreactivity in the PVN. Scale bar, 100 μm. Right: number of OXT-positive neurons in the PVN. b Left: representative images of VP immunoreactivity in the PVN. Scale bar, 100 μm. Right: Number of VP-positive neurons in the PVN. c OXT peptide levels in the hypothalamus. d VP peptide levels in the hypothalamus. Results are expressed as mean ± SEM; *p < 0.05 via Student’s t-test. n = 4 (1:1 sex ratio) per group for (a, b); n = 6 (1:1 sex ratio) per group for (c, d)
