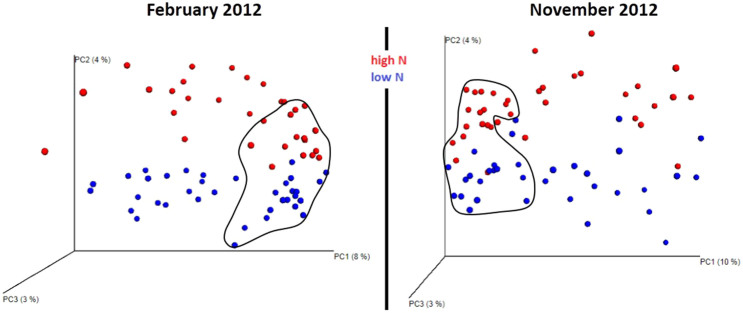
Figure 1. Beta diversity metrics based on fungal ITS1 and ITS2 sequences reveal distinctly clustered rhizosphere and soil (soil data are circled in black) fungal communities structured by nitrogen fertilizer application.
Beta diversity fungal community clustering is observed for non-phylogenetic methods (binary Chord). The percentage of variation explained by the plotted principal coordinates is indicated on the axes.

