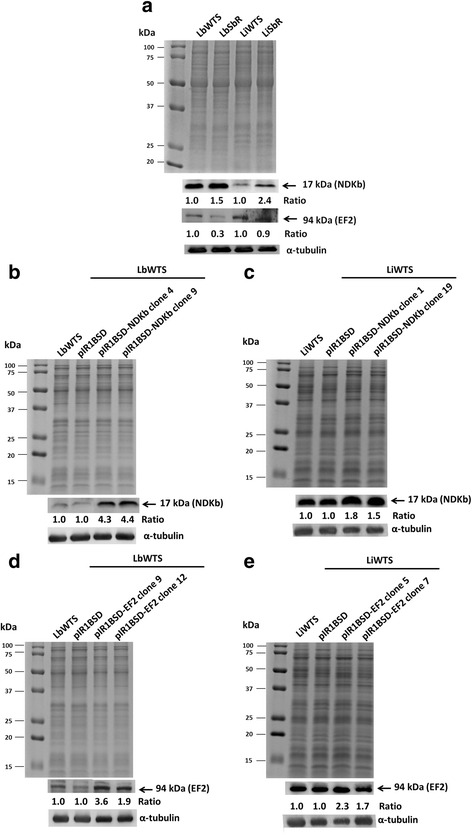
Fig. 1.

NDKb and EF2 expression levels in wild-type (WTS), SbIII-resistant (SbR) and clonal lines from L. braziliensis and L. infantum untransfected or transfected with the constructs pIR1BSD (empty vector), pIR1BSD-NDKb or pIR1BSD-EF2. Total proteins (20 μg) were separated by electrophoresis on 12% SDS-polyacrylamide gel and transferred onto nitrocellulose membranes. The profiles of total proteins stained with Coomassie blue are shown. The blots were probed with rabbit polyclonal anti-NDKb (1:200) (a, b and c) or rabbit monoclonal anti-EF2 (1:200) (a, d and e) antibodies and developed using ECL Plus kit. All membranes were incubated with the anti-α-tubulin monoclonal (1:15,000) antibody for normalization of the results. Quantification of the bands was done by densitometric analysis using the software GelAnalyzer 2010. The figure is representative of all results obtained from two different biological replicates of each sample. The values of each replicate were used to calculate the averages and for determination of the ratios presented for each protein analyzed
