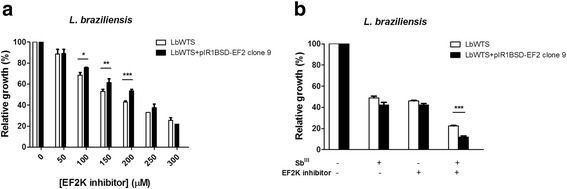
Fig. 5.

EC50 of elongation factor 2 kinase (EF2K) inhibitor for wild-type and EF2-overexpressing L. braziliensis lines (a) and effect of EF2K inhibitor on the growth of L. braziliensis lines upon SbIII exposure (b). Parasites were incubated in M199 medium in the absence or presence of different concentrations of EF2K inhibitor (C13H15N5O3) (50 to 300 μM). For competition assay, cells were exposed to the EC50 of SbIII (7 and 14 μM for the LbWTS and EF2-overexpressing clone 9, respectively) and the EC50 of EF2K inhibitor (173 and 211 μM for the LbWTS and EF2-overexpressing clone 9, respectively) independently or combined, followed by incubation for 48 h. The percentage of relative growth was determined using a Z1 Coulter Counter. Mean values ± standard deviations from three independent experiments in triplicate are shown. Statistical analysis was carried out using Student’s t-test. Statistically different values are highlighted as follows: *P < 0.05; **P < 0.01; ***P < 0.001. Pairwise comparisons (a): 100 μM: t(6) = 3.52, P = 0.0126; 150 μM: t(6) = 3.94, P = 0.0076; 200 μM: t(6) = 8.83, P = 0.0001. (b) Sb III + EF2K inhibitor: t(4) = 11.72, P = 0.0003
