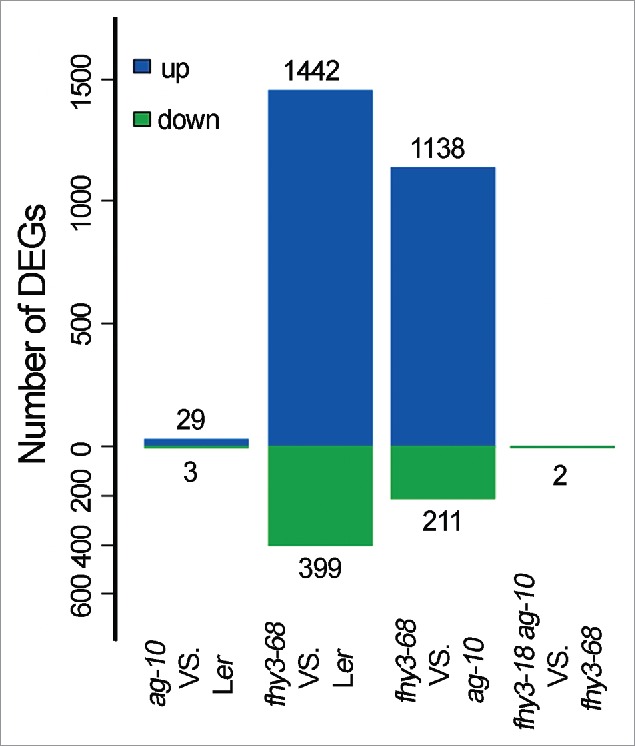
Figure 3.

Number of differentially expressed genes (DEGs) identified in pairwise comparisons of RNA-seq data. The numbers of altered genes are indicated above and below the bars. The higher number of upregulated genes than downregulated genes in fhy3 indicated that FHY3 plays a repressive role in flower development.
