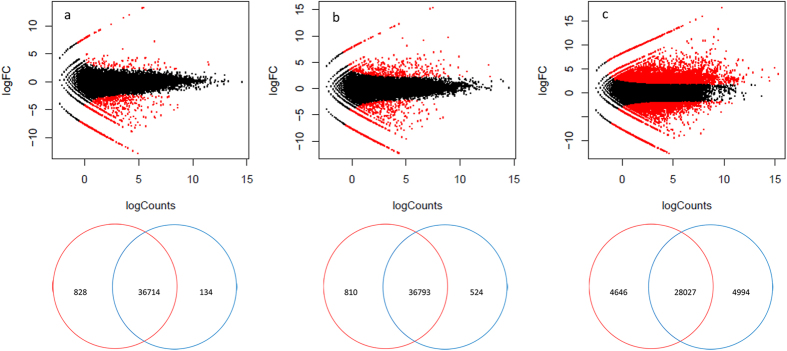
Figure 1. Scatter diagrams representing genome-wide expression profiling comparisons between S1 and the other three stage.
Note: Each black point represents a non-significant difference in gene expression, and each red point indicates a significant differentially expressed gene. Abscissa: log10 (Counts); Ordinate: log2 (FC) expression difference multiple values between two gene samples. a: S1vs. S2, b: S1vs. S3, c:S1vs. S4.

