
Figure 1. Expression level of PD-L1 and its receptor PD-1 in the SMG of NOD/ShiLtJ mice.
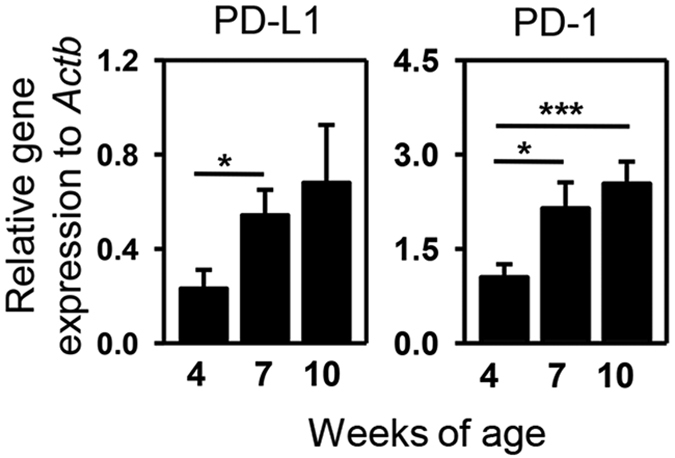
Real-time PCR analysis of PD-L1 and PD-1 mRNA levels in the SMG of NOD/ShiLtJ mice aged 4, 7 and 10 weeks, presented relative to that of β-actin. Data are the average of the analyses of 4–7 mice for each group. Error bars represent the standard error of mean (SEM). *P < 0.05, **P < 0.01; ***P < 0.001.