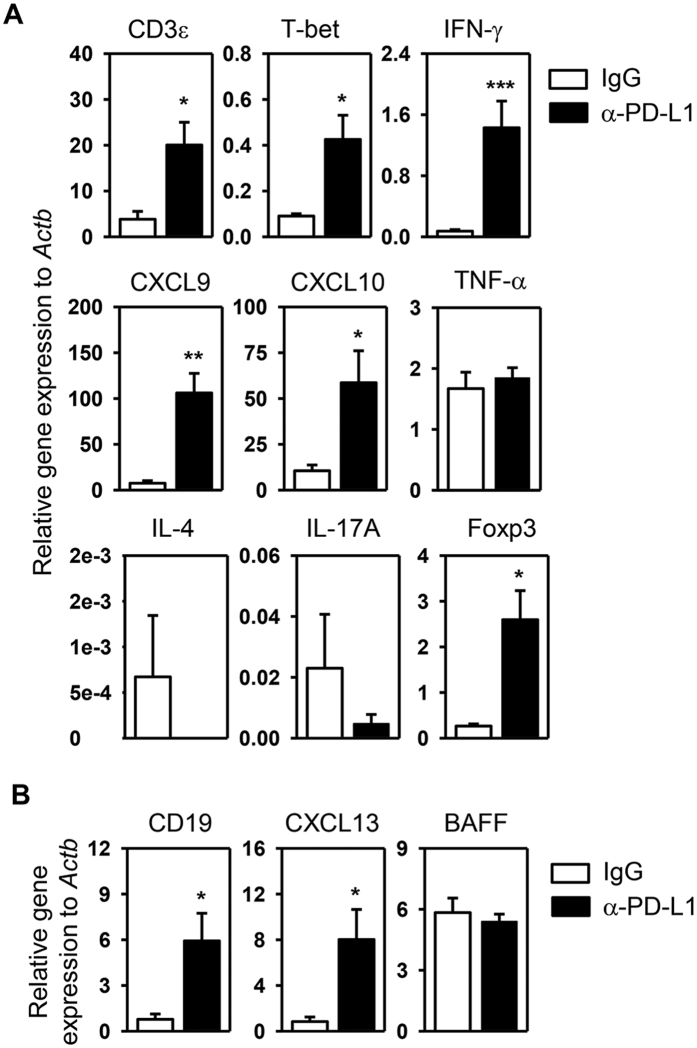
Figure 4. PD-L1 blockade increases expression of Th1 signature molecules and lymphocyte chemoattractants in the SMG.
Anti-PD-L1 or control rat IgG was injected into NOD/ShiLtJ mice as described earlier. Real-time PCR analysis of (A) T cell-associated gene expression and (B) B cell-associated gene expression in the SMG, presented relative to that of β-actin. Data are the average of the analyses of 6–7 mice for each group. *P < 0.05, **P < 0.01; ***P < 0.001.

