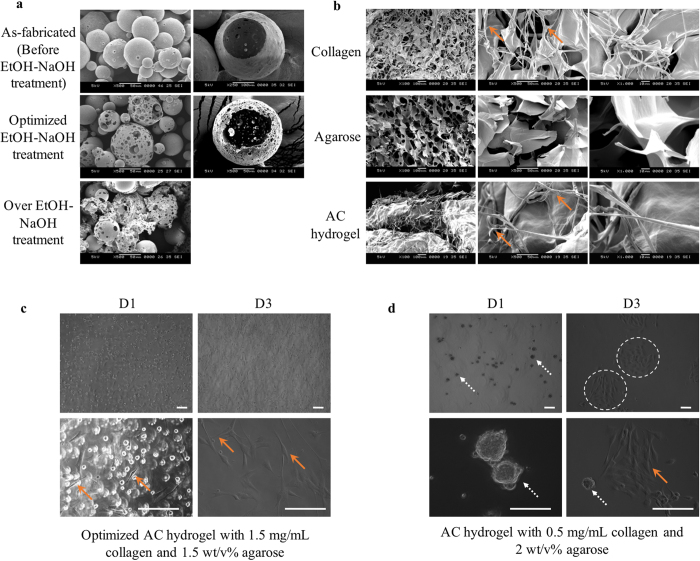
Figure 2. Bioink optimization.
(a) SEM images of PLGA microspheres as-fabricated, optimized treatment (5 min), and over treatment (10 min) of EtOH–NaOH solution. Images on the right show the fractured cross-section of the corresponding microspheres. Most of the over-treated microspheres were fragmented. (b) SEM images showing microarchitecture of 1.5 mg/ml collagen, 1.5 wt/v% agarose and AC hydrogels. Collagen fibrils (arrows) can be observed in collagen and AC hydrogel, but not in agarose. OM images of myoblasts C2C12 cast in AC hydrogels with (c) 1.5 mg/ml collagen and 1.5 wt/v% agarose (optimized and used in this work) and (d) 0.5 mg/mL collagen and 2 wt/v% agarose, after 1 day and 3 days of culture. Images shown were taken from the top surface of the hydrogel to avoid imaging of cells attached to the tissue culture polystyrene (TCPS). AC hydrogel with low concentrations of collagen lacks RGD for cell attachment, e.g. cells colonization (dotted arrows) occurred in the hydrogel with 0.5 mg/ml collagen and 2 wt/v% agarose. Although most of the cells became elongated (arrows) after 3 days of culture, they remained in colonies (dashed circles). Meanwhile AC hydrogel with lower concentrations of agarose (≤1.5 wt/v%) are not favoured in the printing process as gelation of hydrogel in each layer are slow. Bioprinting can be achieved smoothly with fast gelation using optimized AC hydrogel. Cells attained normal morphology (arrows) in the optimized AC concentration. Scale bars, 200 µm.

