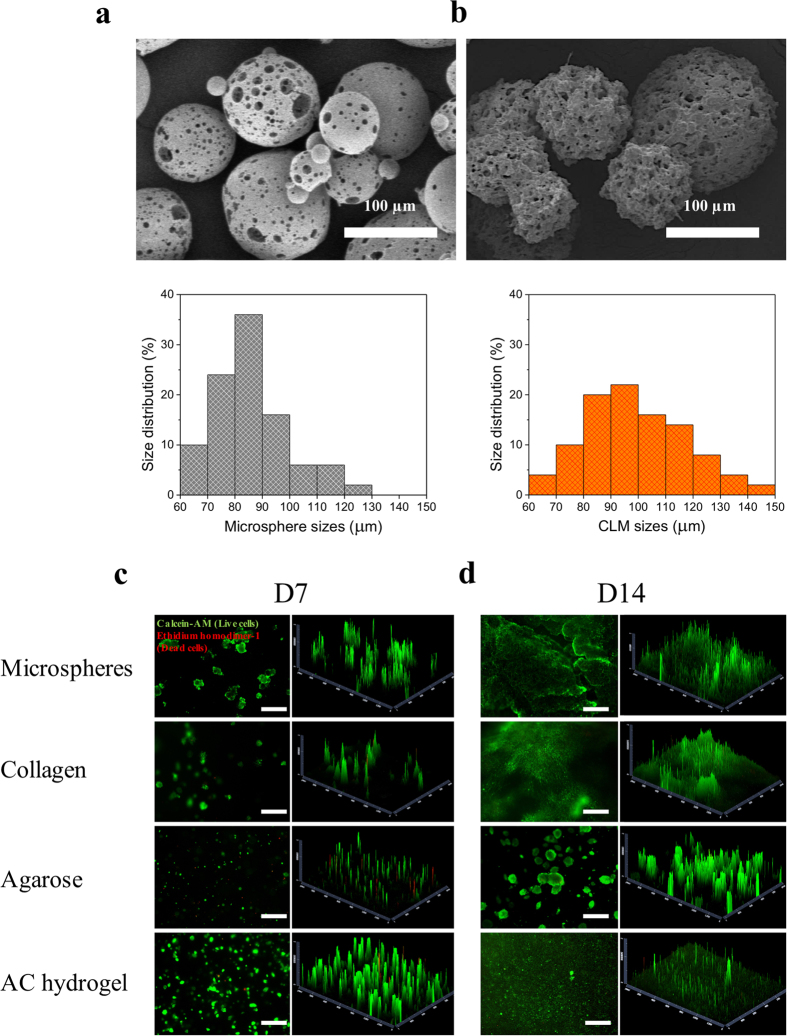
Figure 3. Characterization of the bioink.
SEM images showing (a) the PLGA microspheres and (b) the CLMs. The size distributions of the microspheres and the CLMs were given under the respective SEM image. (c) Day 7 and (d) day 14 L929 cell viabilities on PLGA microspheres, 1.5 mg/mL collagen, 1.5 wt/v% agarose and AC hydrogel. First set of fluorescence images (left) are the live (green)/dead (red) images of the cellular construct captured by the fluorescence microscope; the graphs on the right show the 2.5D reconstruction of the fluorescence images for a clearer visualization of the positions of live and dead cells. Scale bars, 500 μm.

