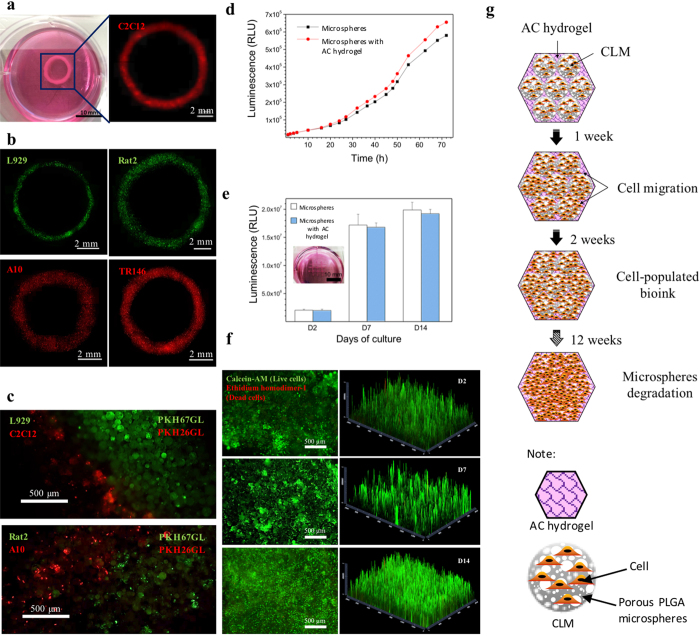
Figure 6. Observation of as-bioprinted ring constructs using different types of cells and cell viability of bioprinted constructs.
(a) Photograph and fluorescence image of a printed ring using C2C12 cells labelled with red fluorescent cell linker PKH26GL. (b) Fluorescence images of printed ring constructs with L929, Rat2, A10 and TR146 cells. L929 and Rat2 cells were labelled by green fluorescent cell linker PKH67GL, and A10 and TR146 cells were labelled with red fluorescent cell linker PKH26GL. The ring-shaped fluorescence images were combined from multiple images of each samples captured under fluorescence microscope. Images (c) reveal patterning of L929 cells (green) together with C2C12 cells (red) and Rat2 cell (green) side-by-side with A10 cell (red) achieved through the printing (d) Real time cell viability and proliferation of printed 3D constructs show that the number of cells was continuously increased over 72 hrs. There were no significant differences between the control and the printed constructs (n = 3). (e) 3D cell viability within the printed construct on the day 2, 7, and 14 of culture after printing shows the cell growth over 14 days. Insert shows the printed construct used for this study. (f) L929 cell viability was over 90% on day 2, 7 and 14 after printing. First set of fluorescence images (left) are the live (green)/dead (red) images of the construct captured by a fluorescence microscope; another set of graphs (right) show the 2.5D reconstruction of the fluorescence images by using ZEN microscope software for a clearer visualization of the locations of the live and dead cells. (g) Schematic illustration of prediction of the cell growth patterns in bioprinted constructs. The PLGA did not show autofluorescence. All fluorescent signals were originated from the labelled viable cells or stained cells.

