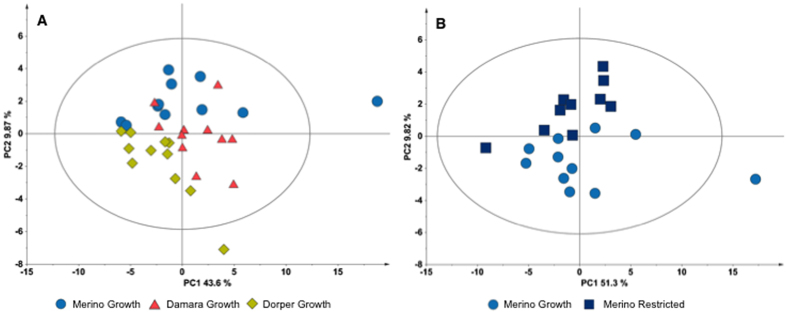
Figure 2. Multivariate analysis of gastrocnemius muscle (aqueous fraction) metabolites concentration.
(A) PCA scores plot for the three growth groups (NC = 2, PC1 = 43.6%, PC2 = 9.87%); (B) PCA scores plot for Merino growth and restricted groups (NC = 2, PC1 = 51.3%, PC2 = 9.82%). Ellipse Hotelling’s T2 (95%).

