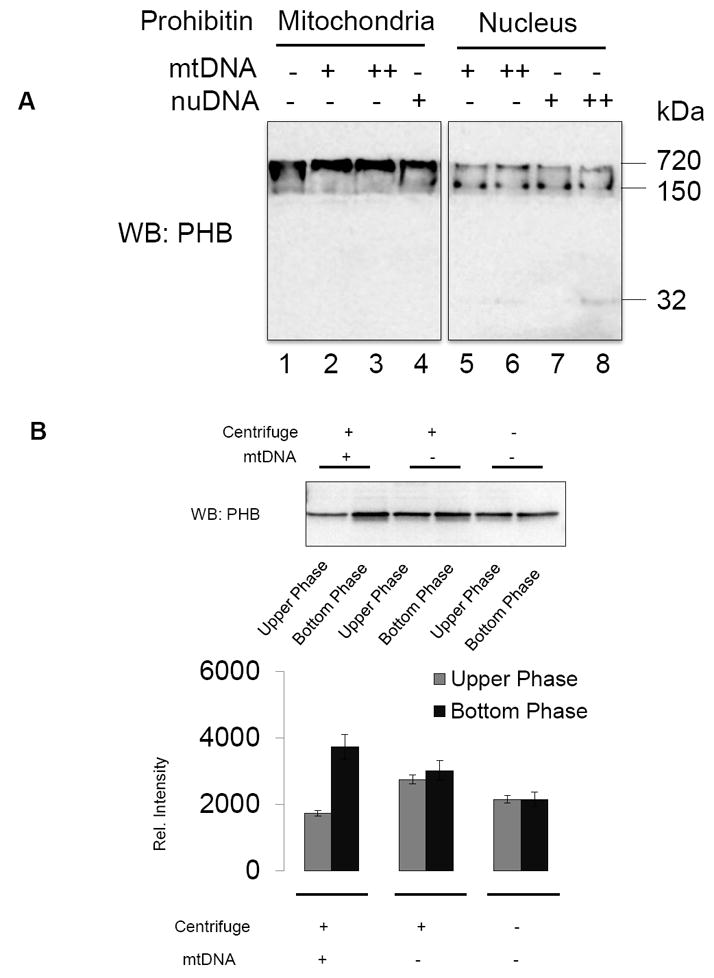
Figure 4. Prohibitin-DNA binding analysis.

A. Mitochondrial and nuclear PHB fractions from bovine retina were mixed with gel-purified mitochondrial (mt) and nuclear (nu) DNA extracted from bovine retina. DNA-protein complexes were analyzed by native-PAGE and prohibitin was quantitated by Western blotting analysis.
B. Ten μg of total proteins in mitochondria (mt) were mixed with 5μg of mitochondrial DNA or TE buffer (negative control) followed by 40 minutes incubation at RT and centrifugation (16,000 × g, 30 minutes). Protein-DNA mixtures from upper half supernatant vs. bottom portion were subjected to SDS-PAGE (8–16%), and prohibitin expression was visualized by Western blotting analysis. Data showed mtPHB and mtDNA formed complexes and precipitated down to the bottom of the sample. Bands were quantified by QuantityOne software.
