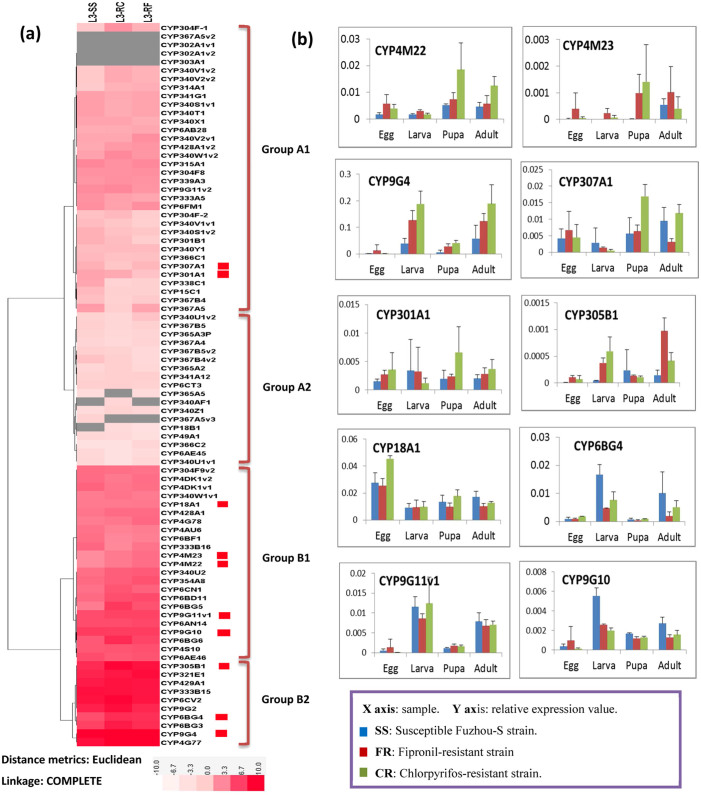
Figure 3. Strain-specific expression of the P. xylostella P450s.
(a) Hierarchical clustering of the 85 PxP450s based on RPKM values from the transcriptome sequencing. The log2 RPKM values are presented with varying colors. The darker red represents higher expression values, and the gray in the heat map missing values. L3-SS: 3rd-instar larva from the susceptible strain; L3-FR: 3rd-instar larva from the fipronil-resistant strain; and L3-CR: 3rd-instar larva from the chlorpyrifos-resistant strain. (b) qRT-PCR-based expression of 10 selected P. xylostella P450s across four development stages in three strains.

