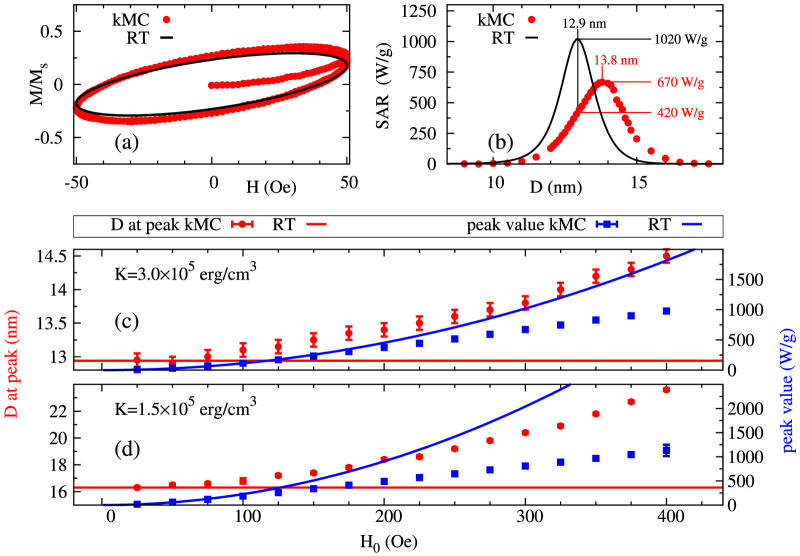
Figure 2. Comparisons between RT (solid lines) and kMC calculation (symbols) for a system of identical particles with easy axes aligned in the field direction for: T = 300 K, Ms = 400 emu/cm3, K = 3 × 10⁵ erg/cm3, f = 100 KHz.
(a–b): Magnetisation loops for particle size of 13 nm at 50 Oe (a) and SAR as function of particle size at 300 Oe (b). (c–d): Maximum SAR value and the location of the peak in SAR for K = 3 × 10⁵ erg/cm3 (c) and K = 1.5 × 10⁵ erg/cm3 (d).

